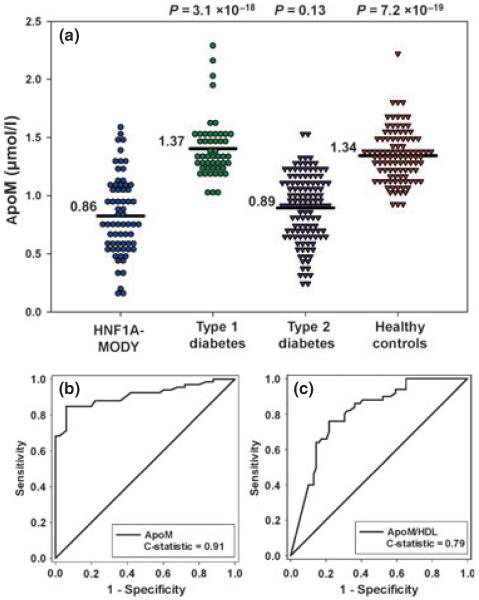
FIGURE 1.
(a) Dot histogram illustrating apoM concentration for the study groups; mean values are indicated by the black line. (b) Receiver operating characteristic curve illustrating the capacity of apoM to distinguish between HNF1A-MODY and Type 1 diabetes. The C-statistic for this comparison is 0.91. (c) Receiver operating characteristic curve illustrating the capacity of apoM/HDL to distinguish between HNF1A-MODY and Type 1 diabetes. ApoM, apolipoprotein M; HNF1A, hepatocyte nuclear factor 1 alpha; MODY, maturity-onset diabetes of the young.

