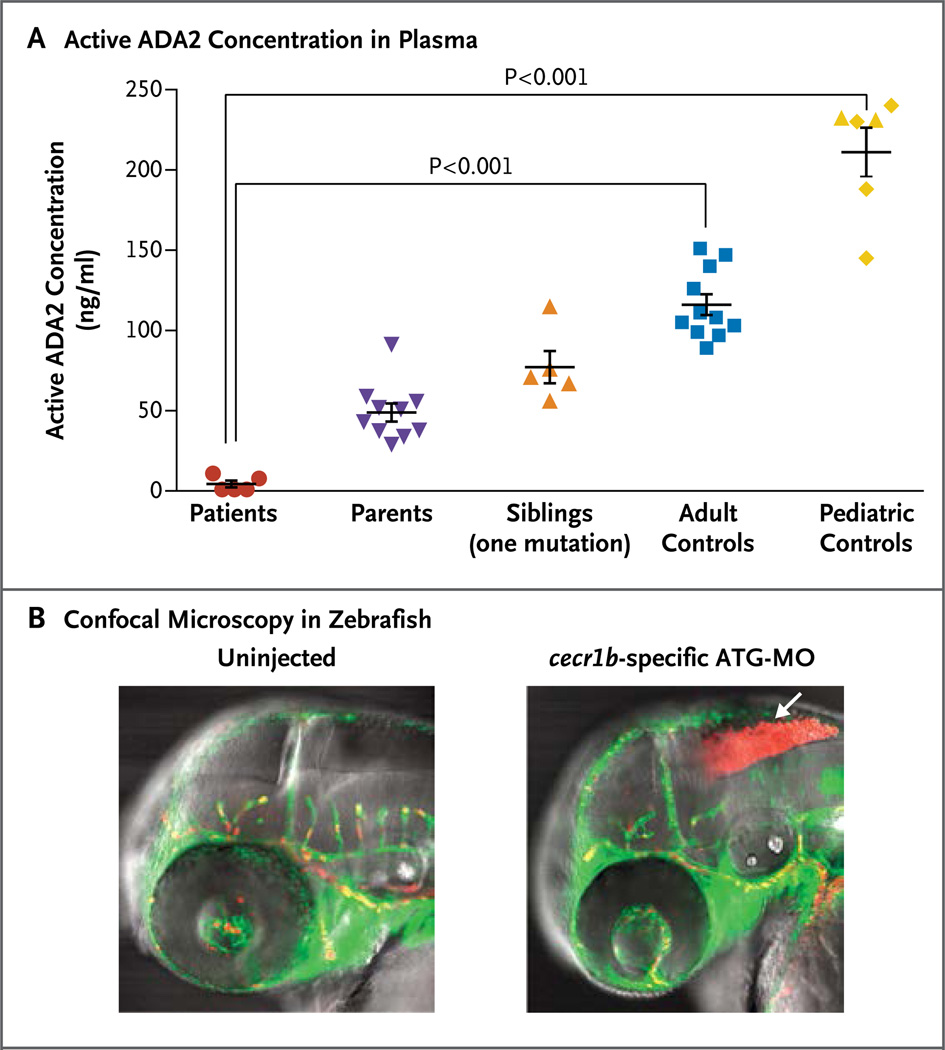
Figure 2. Evidence of Loss-of-Function Mutations in ADA2.
Panel A shows ADA2 activity in plasma samples from five patients with stroke (red circles), relatives who are clinically asymptomatic carriers of one mutation (purple triangles and orange triangles), healthy adult controls (blue squares), and healthy pediatric controls (yellow diamonds) (see the Supplementary Appendix). Two siblings (yellow triangles) who are not carriers of ADA2 mutations clustered appropriately with pediatric controls. Plasma specimens were titrated against recombinant ADA2 standards to quantitate the amount of nonmutant protein that would give equivalent activity. The horizontal lines represent mean values, and the I bars the standard error. Panel B shows confocal microscopy in zebrafish. Transgenic expression of enhanced green fluorescent protein under the fli1 promoter labels blood vessels green; expression of red fluorescent protein from discosoma species under the gata1 promoter labels erythrocytes red. Intracranial bleeding (arrow) is observed in embryos injected with cecr1b-specific morpholino oligonucleotides, targeting the translation initiation site (ATG-MO). Similar results were observed for embryos injected with the splice-blocking morpholinos targeting the proper splicing of exon 3.

