Figure 4.

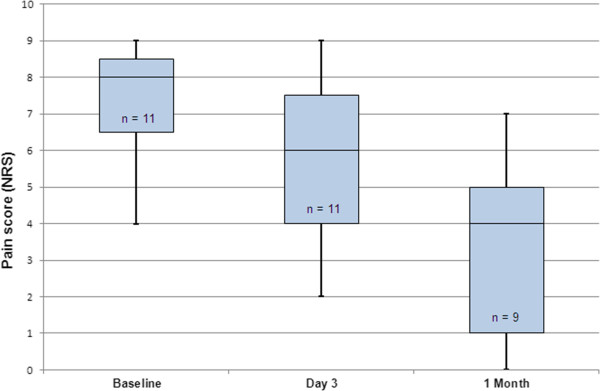
Pain response. Boxplot of pain scores before treatment, 3 days after treatment, and 1 month after treatment. In the graph, the median is shown (middle black line), minimum and maximum values (bars), and lower and upper quartiles (boxes).

Pain response. Boxplot of pain scores before treatment, 3 days after treatment, and 1 month after treatment. In the graph, the median is shown (middle black line), minimum and maximum values (bars), and lower and upper quartiles (boxes).