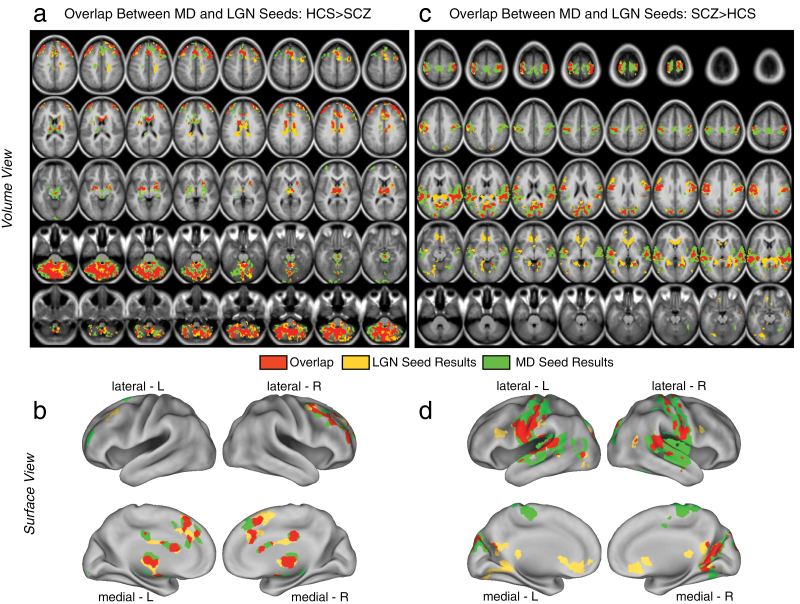
Fig. 2.
Formal overlap analysis between mediodorsal (MD) vs occipital-projecting thalamic nuclei group differences in schizophrenia (SCZ). (a and b) Regions exhibiting reductions for SCZ vs HCS are shown for the LGN seed-based results (yellow) vs MD seed-based results (green). The overlap is shown in red. (c and d) Regions exhibiting increases in connectivity for SCZ vs HCS are shown with the same color scheme as panel a. The overlap analysis (red) indicated similar patterns for MD and LGN seed-based results in areas showing reductions for SCZ vs HCS (panels a and b). In contrast, for areas showing increases in SCZ vs HCS, there were notable differences in between MD and LGN seeds (eg, LGN seed-based results indicated more prominent differences in both medial prefrontal clusters and parts of visual cortex, see table 2 for a complete list of overlapping foci). Note: Panels a and c show the results in a volume representation, whereas panels b and d show the same data mapped onto a surface representation.

