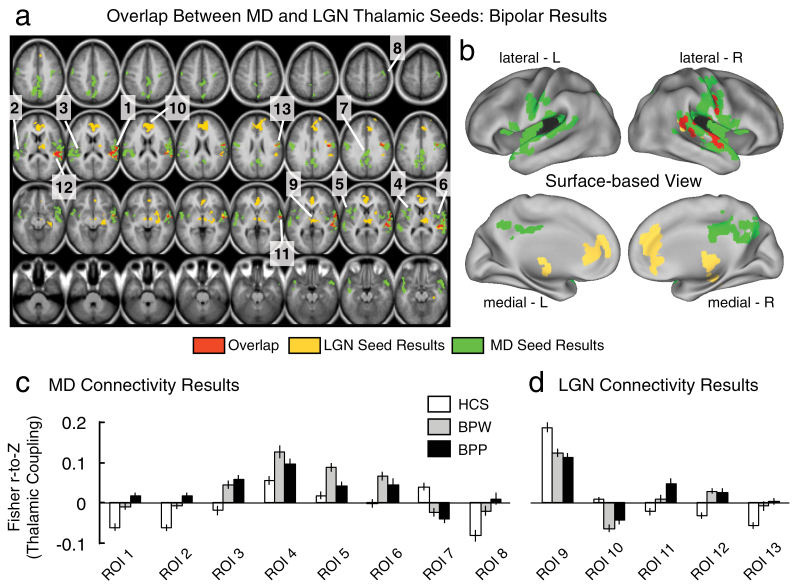
Fig. 3.
Differences in mediodorsal (MD) vs occipital-projecting thalamic nuclei in bipolar disorder (BD) with and without psychosis history. (a and b) 1-way ANOVA results for the MD thalamic seed (green) and the occipital-projecting LGN thalamic seed (yellow) showing differences between bipolar groups (with and without psychosis history, BPP and BPW) and healthy comparison subjects (HCS). The formal overlap between the 2 seeds is shown in red. Each of the surviving regions of interest (ROI) is marked with a number, corresponding to the ROI label on the x-axis in panels c and d. (c) Magnitudes of connectivity between the MD seed and each of the identified foci across the 3 groups, to facilitate interpretation of the ANOVA effect. (d) Magnitudes of connectivity between the LGN seed and each of the identified foci across the 3 groups. The pattern shows that in only a few cases is the effect driven by psychosis history (ie, the BPP group). Also, as evident from the maps, the LGN and MD seeds revealed largely non-overlapping patterns of between-group differences (unlike patterns in SCZ). Error bars mark ±1 SEM. Complete maps of group pairwise comparisons (ie, BPW vs HCS and BPP vs HCS) are shown in figure 4; for a complete list of overlapping foci, see table 3. Note: Volume-based results are displayed in panel a, whereas panel b shows the same data mapped onto a surface representation.

