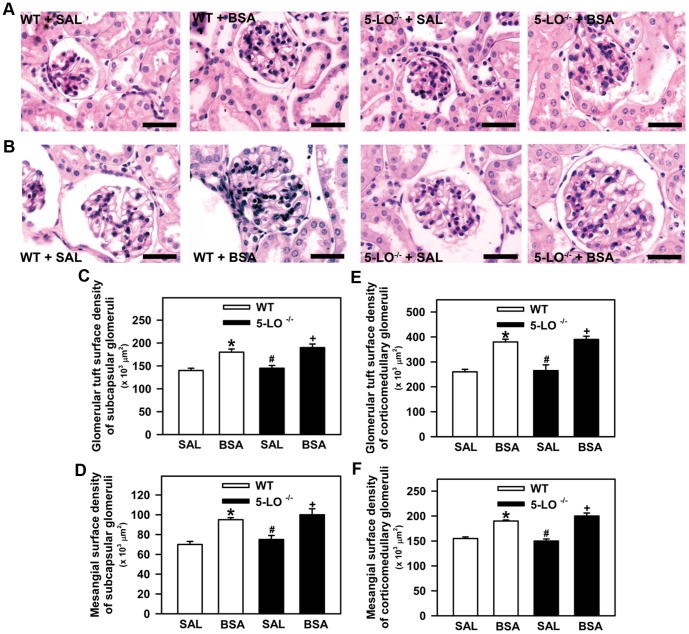
Figure 4. Glomerular morphology in WT and in 5-LO-deficient mice after 7 days of treatment with saline or BSA.
Mice were treated as described in Fig. 1 (n = 6 per group). Kidney sections were stained with periodic acid–Schiff. (A) Representative photomicrographs of the subcapsular glomeruli (bar = 40 µm) and (B) corticomedullary glomeruli (bar = 40 µm). Quantitative analysis of (C) the glomerular tuft surface of the subcapsular glomerulus, (D) the glomerular tuft surface of the corticomedullary glomerulus, (E) the mesangial surface of the subcapsular glomerulus, and (F) the mesangial surface of the corticomedullary glomerulus. The results are expressed as means ± SE. Statistically significant in relation to *WT+SAL (p<0.05), #WT+BSA (p<0.05), +5-LO–/–+SAL (p<0.05).

