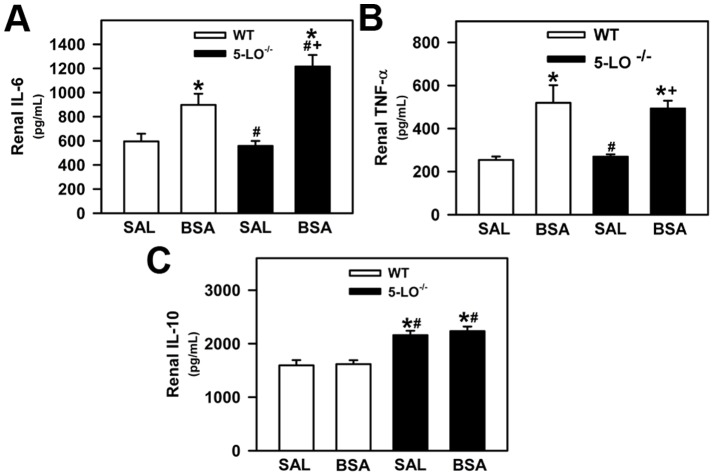
Figure 8. Analysis of renal cytokines in WT and 5-LO-deficient mice after saline or BSA treatments.
(A) Renal IL-6, (B) TNF-α, and (C) IL-10 levels were determined by ELISA. The results are expressed as means ± SE. Statistically significant in relation to *WT+SAL (p<0.05), #WT+BSA (p<0.05), +5-LO–/–+SAL (p<0.05).

