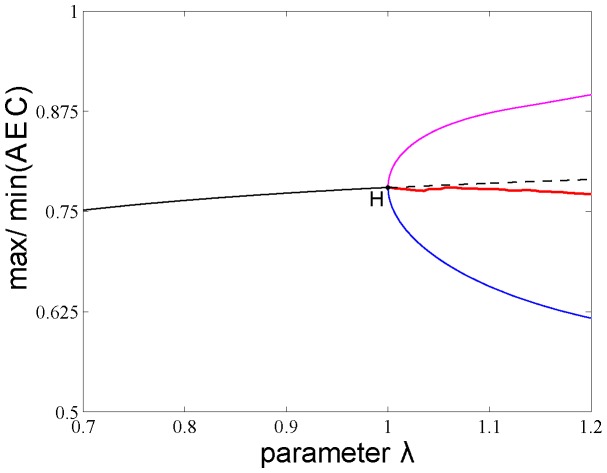
Figure 6. Robustness analysis for the adenylate energy charge (AEC) across different modeling conditions.
In y-axis we have plotted the max and the min of the AEC. For situations with no oscillations stable fixed are point colored in solid black lines. In x-axis we have plotted the  control parameter, which models the energy level stored in the proton gradient generated by the enzymatic oxidation of input nutrients. From left to right, we can see that the system has a fixed point solution which is stable for
  <1 (black solid line) and becomes unstable for
  >1 (black dashed line), i.e., there is a Hopf bifurcation (H) at
  ∼1. For
  >1, the limit cycle solution becomes stable, in magenta (blue) we have colored the max (min) of the oscillations. In red, we are coloring the average AEC value of the oscillations. For
  <1, the AEC values range from 0.752 and 0.779, and for
  >1, the AEC average value between the maximum and minimum per period range from 0.768 to 0.756. At very small
  values, for
  the AEC exhibits values below 0.6 (Figure 7). The AEC does not substantially change during the simulations indicating that it is strongly buffered against the changes of the main control parameter of the system.

