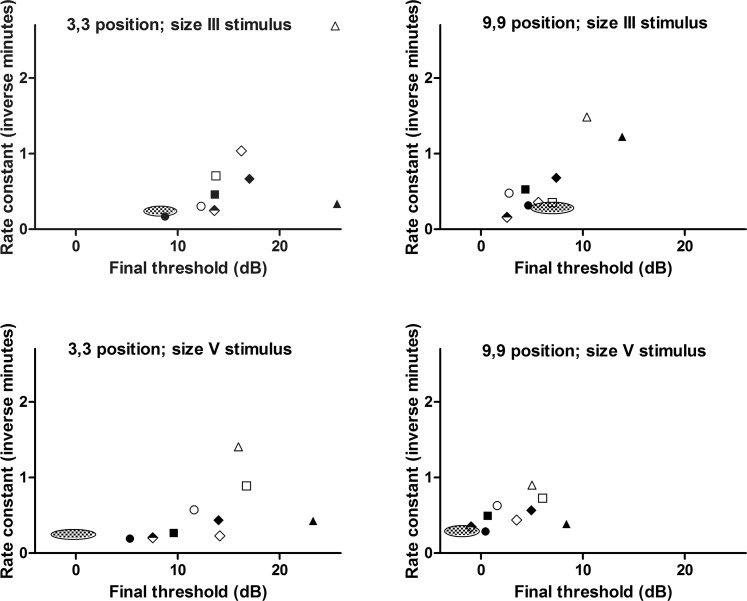
Figure 3.
Plots showing the nine individual ACHM subjects' rate constant (inverse minutes) versus final threshold (dB), in each of the four condition sets tested (indicated by plot title). The 95% CI for the mean of these parameters measured in the normal subjects is shown for comparison (checkered ellipse). There is a statistically significant positive correlation between final threshold and rate constant in one of the four condition sets tested (9,9 position, size III stimulus; Spearman r = 0.72; P = 0.037), see text for further discussion. Subject key: Subject 1, filled square; Subject 2, filled circle; Subject 3, empty circle; Subject 4, empty diamond; Subject 5, filled diamond; Subject 6, empty square; Subject 7, filled triangle; Subject 8, empty triangle; Subject 9, half-filled diamond.

