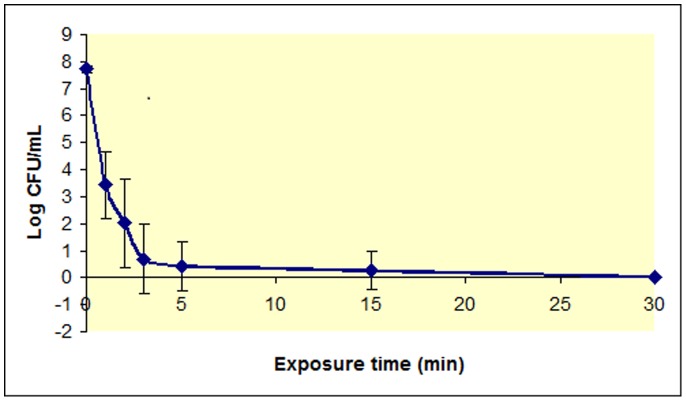
Figure 1. Survivor curve for P. aeruginosa plasma-treated biofilms.
Log of the number of P. aeruginosa CFU/mL vs plasma exposure time (0 to 30 minutes). Results are the average of five independent experiments. Each experiment was performed in duplicate. Bars represent the standard error of the mean.

