
Figure 5. P. aeruginosa biofilm force-displacement curve adhesive step data for 0 minute (control) plasma-treated sample 1.
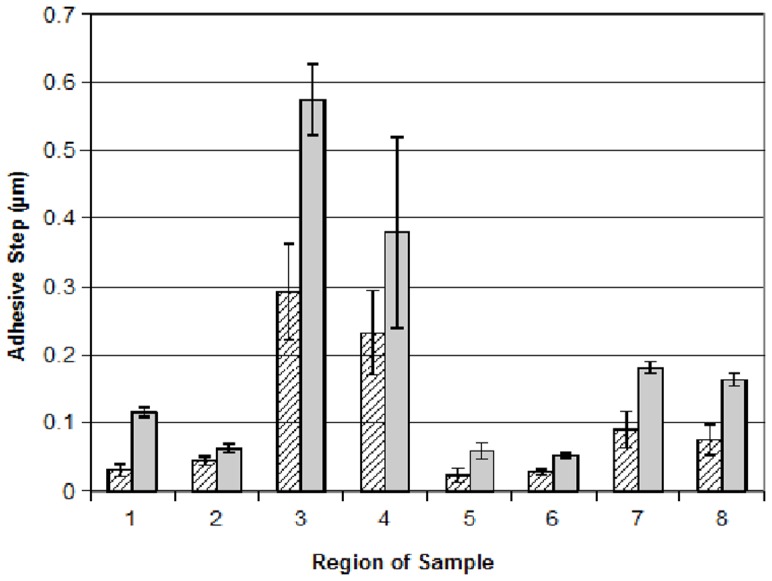
The height of each bar on the graph corresponds to the mean adhesive step height of five curves obtained for each region. Error bars represent the standard error of the mean. Hatched bars and solid bars represent measurements on mostly bacteria and mostly matrix areas, respectively.