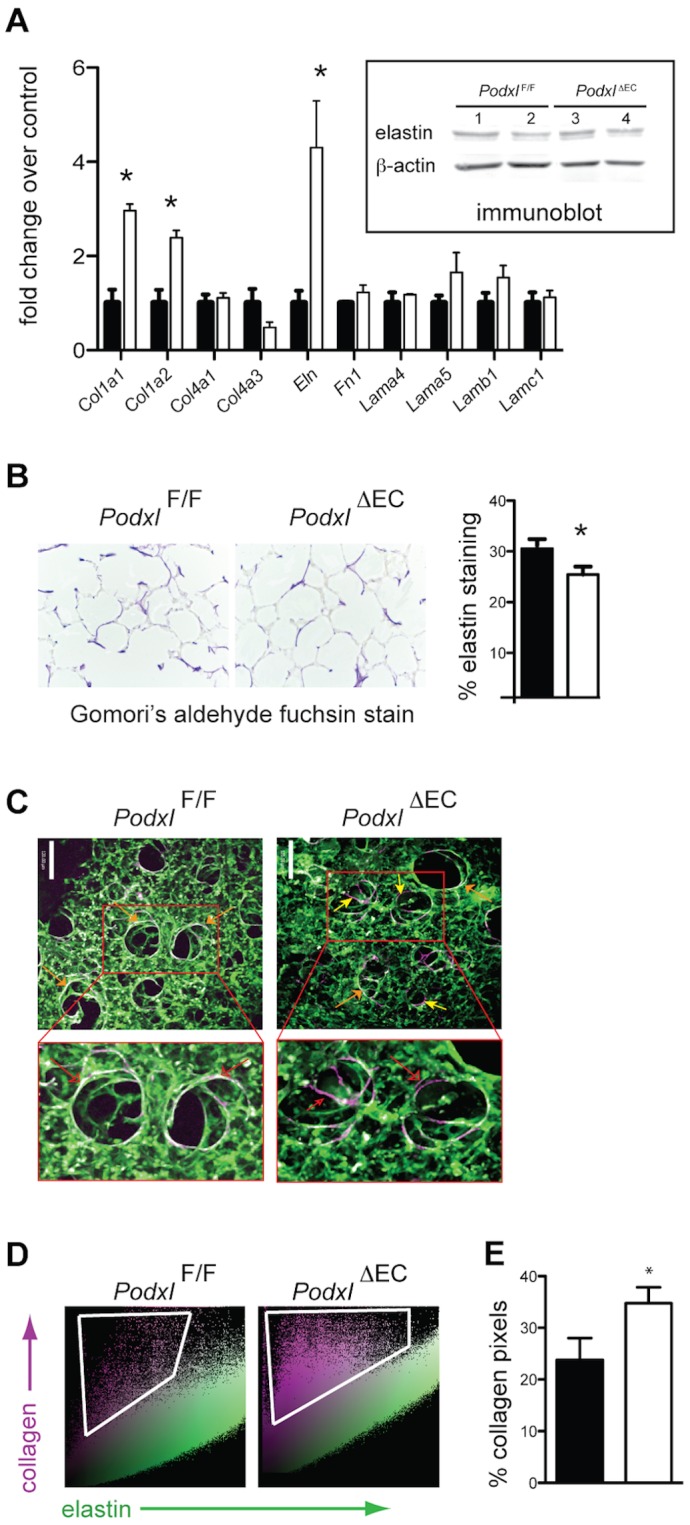
Figure 5. Podocalyxin deletion results in altered matrix deposition in the lung.

(A) Whole lung tissue from PodxlF/F (black bars) and Podxl ΔEC (white bars) mice was assessed for expression of matrix related transcripts by qRT-PCR (n = 3 mice per group) and for tropoelastin protein by Western blot (inset). Immunoblot lanes are from whole lung tissue lysates and each lane is a sample of lung lysate prepared from a single mouse. (B) Representative images of sections stained with Gomori's aldehyde fuchsin stain to highlight elastin. The % elastin staining was quantified by the threshold area of elastin staining to total tissue area (n = 6 mice per genotype). (C) Representative optically magnified SHG image originating from the collagen matrix overlaid with the MPEF images (scale bar = 120 µm). These are 3D extended focus views representing ∼150 µm thick tissue section. The collagen appeared to be in the form of spirally wound collagen (violet color) while the lung elastin (green color) consisted of fine fibers. Areas of fibrillar collagen co-localized with elastin appear white in colour (orange arrows). While collagen-elastin co-localization is common (e.g., see PodxlF/F lung SHG images), the Podxl ΔEC exhibit areas of elastin-free collagen (violet) primarily in larger alveolar spaces (yellow arrows). Images shown are representative of 2 images per mouse and 3–5 mice per group. (D) The representative scatter plots of the images presented in (C) where SHG pixel intensities (y-axis) are plotted as a function of elastin pixel intensities (x-axis). Elastin-free collagen SHG signals are considerably higher in Podxl ΔEC lungs when compared to PodxlF/F lung samples. (E) Quantification of violet elastin-free collagen pixels in the scatter plots represented in (D). The % elastin-free collagen is calculated base on the number of pink pixels compared to the total number of pixels in each dot plot. *Significantly different with P<0.05 by Student's t test when compared to PodxlF/F mice. The error bars represent the SEM.
