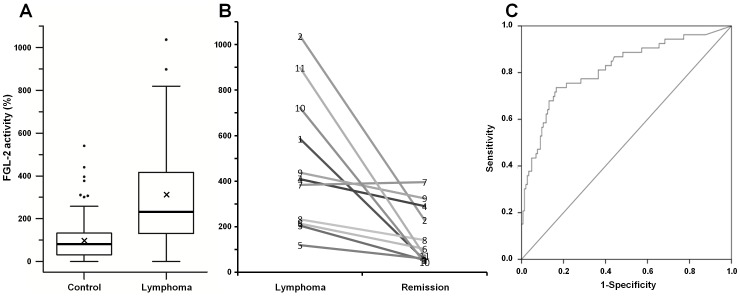
Figure 1. Prothrombinase activity of FGL-2 in PBMC.
A - Boxplot presentation of FGL-2 activity in PBMC from lymphoma patients (n = 53) and controls (n = 145). FGL-2 activity was measured by thrombin generation assay and expressed as a percent activity relative to healthy controls. Thick line represents median activity and X indicates the mean activity. B - FGL-2 activity of eleven B-Cell lymphoma patients during active disease and remission. C - Sensitivity and specificity ROC analysis. The area under the curve is 0.817, standard error: 0.037.

