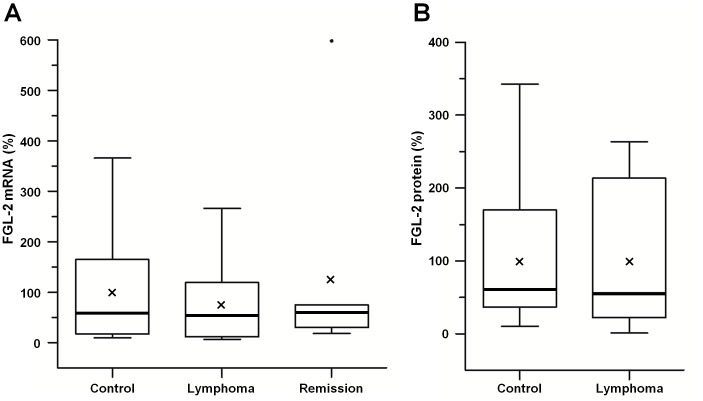
Figure 2. fgl-2 mRNA and protein levels analyses.
Comparative boxplot presentation of fgl-2 mRNA and protein levels in PBMC of lymphoma patients and controls. A- Fgl-2 mRNA was analyzed by RT-PCR and determined relative to the house-keeping gene, abl-1. The mRNA levels of fgl-2 from PBMC of patients with active B-cell lymphoma (n = 12) and B-cell lymphoma in remission (n = 7) are expressed relative to healthy controls (n = 13). B - FGL-2 protein level was analyzed by ELISA. The protein levels of FGL-2 from PBMC of patients with active B-cell lymphoma (n = 10) are expressed relative to healthy controls (n = 9). Thick line represents median and X indicates the mean values.

