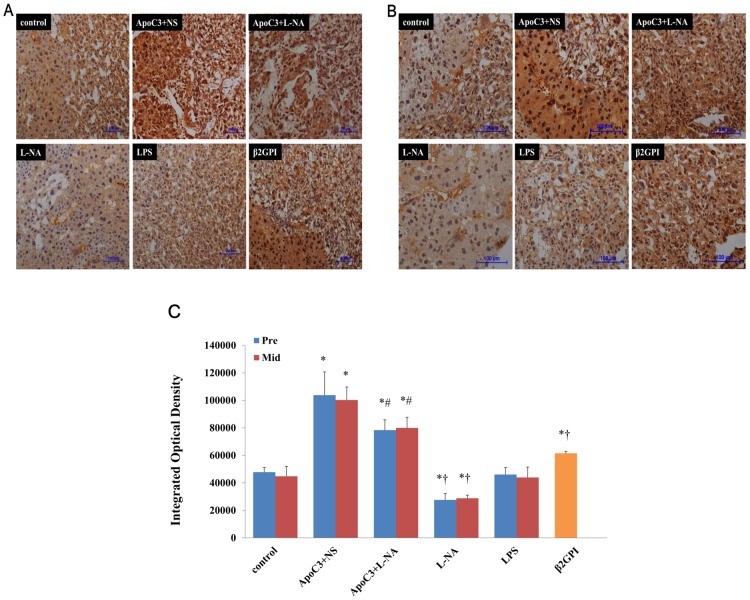
Figure 7. Representative immunohistochemical staining of LCHAD in mouse placenta at pre-implantation (A) and mid-gestational age (B).
(Original magnification ×100, scale bars 100 µm) (C): IOD of placenta immunohistochemical images in all groups. *P<0.05 compared with control. †P<0.05 compared with ApoC3+L-NA. #P<0.05 compared with ApoC3+NS. Data are mean±SD, n = 10. Pre, pre-implantation. Mid, Mid-gestation.

