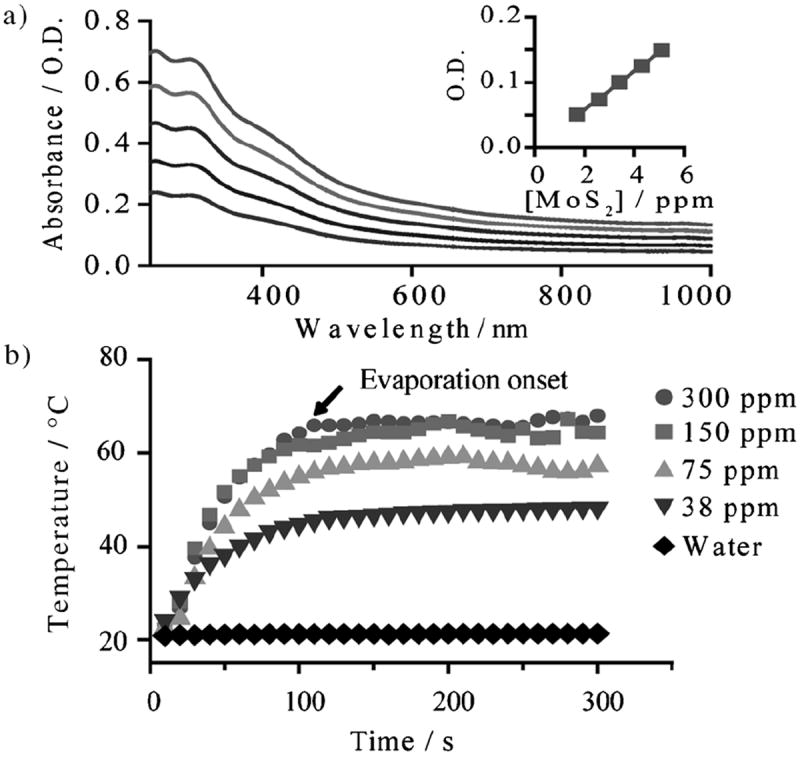
Figure 2.

a) Absorbance profile of ceMoS2. The top curve is 5 ppm. Each subsequent curve is 0.5 times diluted. The inset is the Beer’s law plot at 800 nm (O.D. = optical density). b) Photothermal heating curves of ceMoS2 across a range of concentrations.
