
Figure 4.
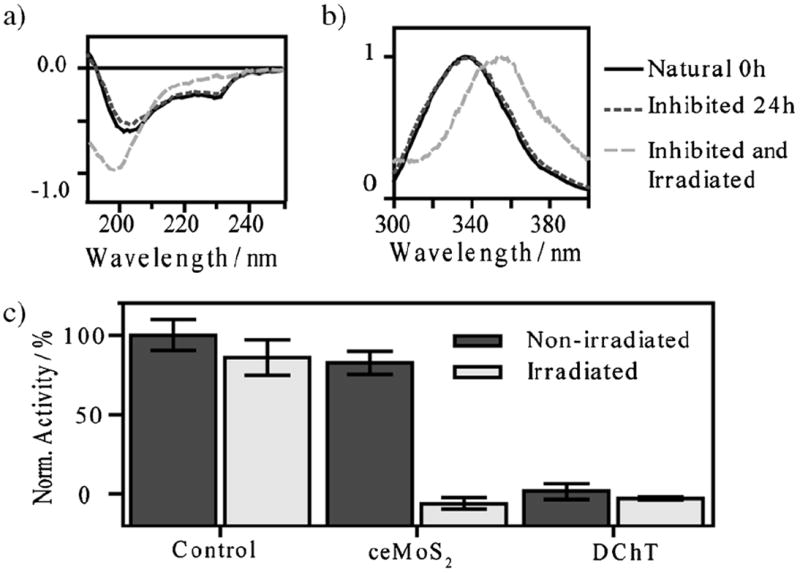
a) Normalized CD and b) fluorescent spectra of select ChT samples after various treatments. A full set of samples is available in the Supporting Information (Norm. = normalized intensity). c) Normalized activity assay of ceMoS2-ChT or decoupled ChT in 750 mm NaCl after various treatments.