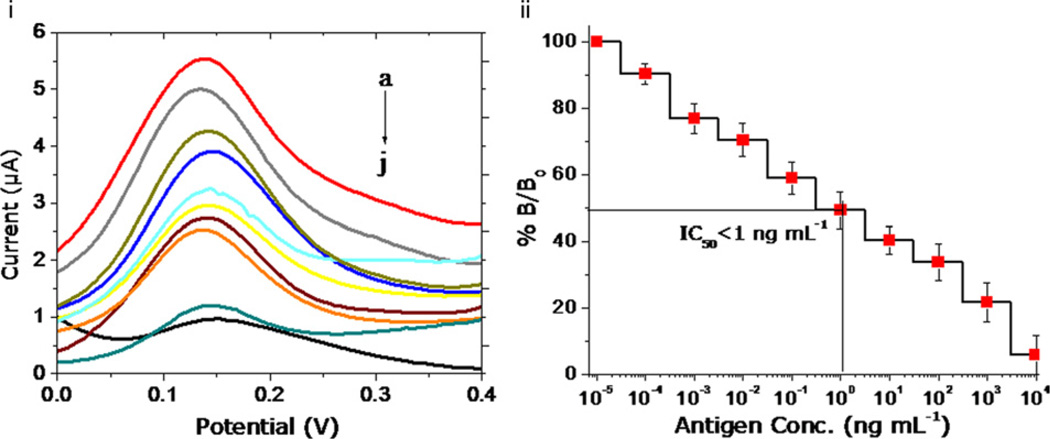
Fig. 5.
(i) Electrochemical response curve of fG–GO modified SPE in a competitive immunoassay format for the different concentrations of standard diuron samples (a) 0, (b) 0.0001, (c) 0.001, (d) 0.01, (e) 0.1, (f) 1, (g) 10, (h) 100, (i) 1000, and (j) 10,000 ng mL−1. (ii) Calibration plot for diuron in the range from 0.1 pg mL−1 to 10 µg mL−1 (n=3). The antibody concentration of 25 µg mL−1 was selected for immunoassay development.

