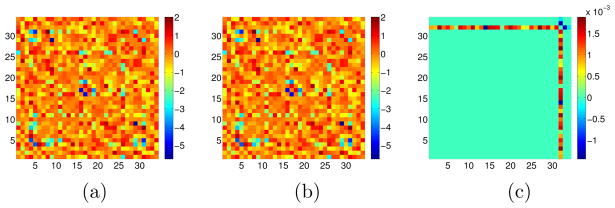
Figure 11.
GBM data analysis for PNJGL with q = 2. The sample covariance matrices S1 and S2 were generated from samples with two cancer subtypes, with sizes n1 = 53 and n2 = 56. Only the 34 genes contained in the Reactome “TCR Signaling” pathway were included in this analysis. Of these genes, three are frequently mutated in GBM: PTEN, PIK3R1, and PIK3CA. These three genes correspond to the last three columns in the matrices displayed (columns 32 through 34). PNJGL was performed with λ1 = 0 and λ2 = 2. We display (a): the estimated matrix Θ̂1; (b): the estimated matrix Θ̂2; and (c): the difference matrix Θ̂1 − Θ̂2. The gene PTEN is identified as perturbed.

