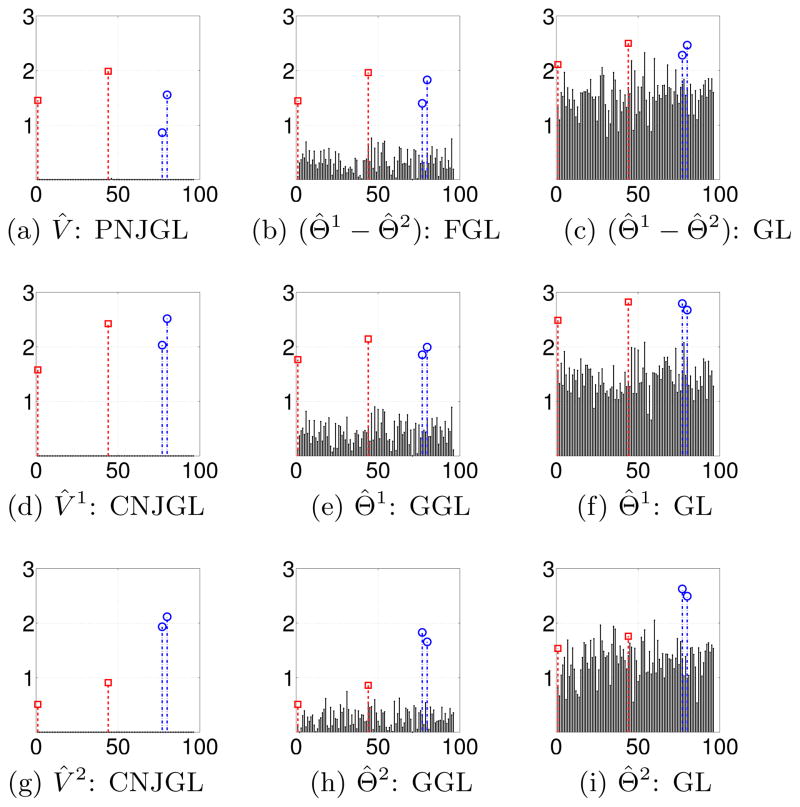
Figure 16.
In all plots, the x-axis indexes the columns of the indicated matrix, and the y-axis displays the ℓ2 norms of the columns of the indicated matrix, with diagonal elements removed. The sample size is n = 25. Perturbed nodes are indicated in red (with square markers), and cohub nodes are indicated in blue (with circle markers). (a)–(c): Detection of perturbed nodes by PNJGL with q = 2, FGL, and GL. (d)–(i): Detection of cohub nodes by CNJGL with q = 2, GGL, and GL. (a): PNJGL with q = 2 was performed with λ1 = 2.5 and λ2 = 12.5. (b): FGL was performed with λ1 = 2.5 and λ2 = 0.75. (c): GL was performed with λ = 1.5. (d), (g): CNJGL was performed with q = 2 and λ1 = 0.5, λ2 = 37.5. (e), (h): GGL was performed with λ1 = 0.5 and λ2 = 2.5. (f), (i): GL was performed with λ = 0.75.

