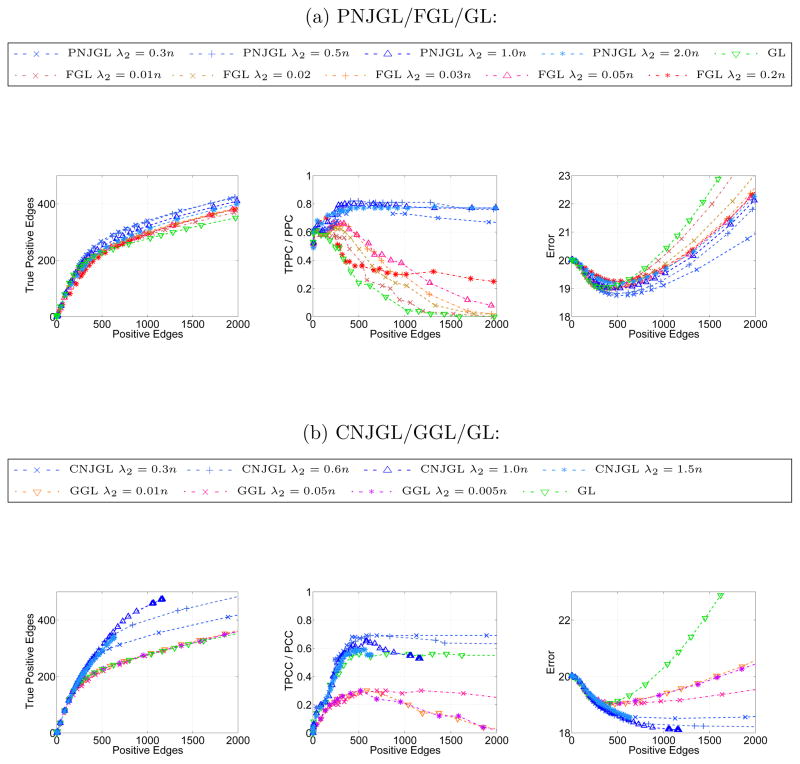
Figure 9.
Simulation results on scale-free network (Section 6.1.2) for(a): PNJGL with q = 2, FGL, and GL, and (b): CNJGL with q = 2, GGL, and GL, with p = 100 and n = 50. Each colored line corresponds to a fixed value of λ2, as λ1 is varied. Axes are described in detail in Table 1. Results are averaged over 50 random generations of the data.

