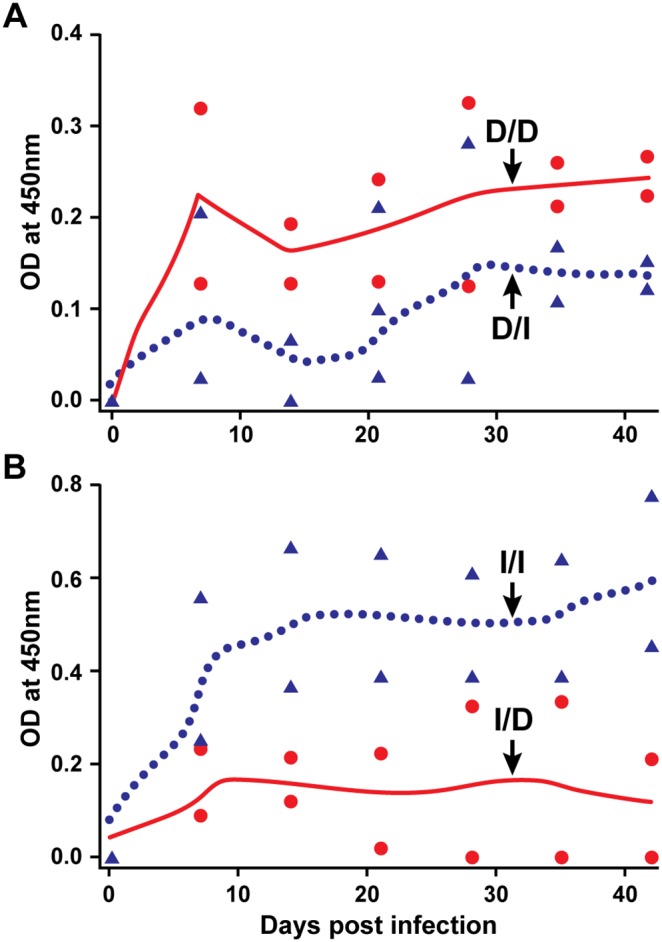
Figure 6. E. chaffeensis-specific IgG response in dogs receiving infection by i.v. with DH82 culture-derived inoculum (A) or i.v. with ISE6 culture-derived organisms (B).

Black circle data points and black line (polynomial smoothened line) in panel A refer to IgG data for DH82 culture infected animals using DH82 culture-derived antigens (D/D), while the black triangles and dotted line represent IgG response data generated with ISE6 culture-derived antigens (D/I). Panel B; as in A, except that the dogs in this group were infected with ISE6 culture-derived inoculum and antigens used in the ELISA analysis are either from derived from DH82 (I/D) (black circle data points and black line) or ISE6 (I/I) (black triangles and dotted line) cells. The Y-axis scales differ between charts.
