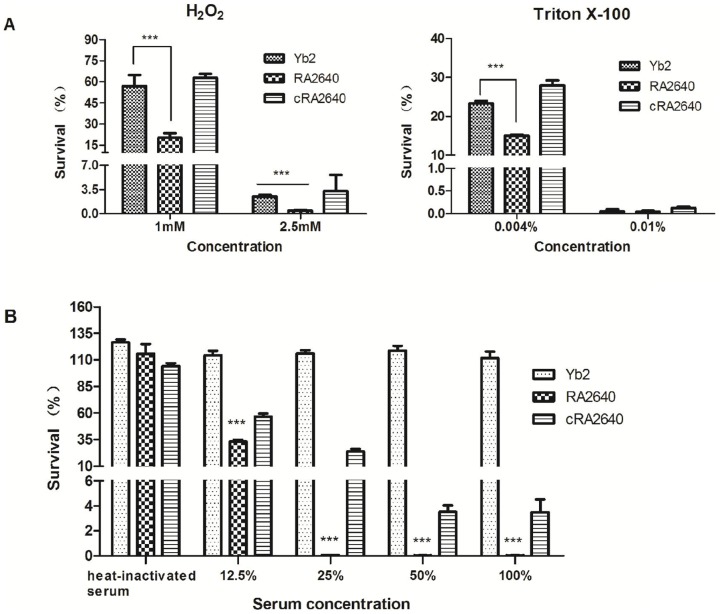
Figure 4. Sensitivity to disinfectants and normal duck sera.
(A) Susceptibilities to hydrogen peroxide and Triton X–100, expressed as survival rate after incubation of bacteria with disinfectants at 37°C for 30 min as compared to PBS. Bars represent the means ± standard deviation of the results found in three experiments. (B) Susceptibilities to normal duck sera, expressed as survival rate after incubation of bacteria with normal duck sera at 37°C for 30 min at different dilutions as compared to PBS. ***, p<0.001. Error bars represent the standard deviation of three independent experiments.

