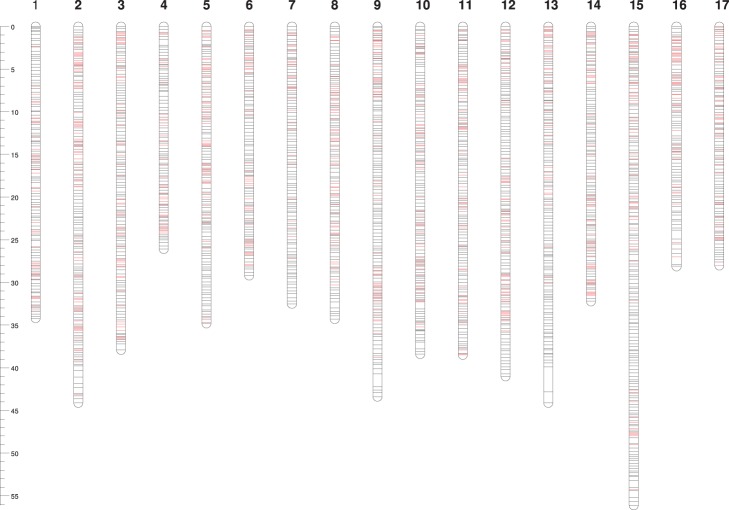
Figure 3. Distribution of focal points (FPs) (black lines) and IRSC SNPs (red lines) in the apple physical map v2.
All positions are in Mbps. The average distance between FPs is 311 Kbps. Only two regions longer than 1 Mbps located at the distal end of Chrs 9 and 13 are not covered by FPs and SNPs from the 8K IRSC SNP array. Scale bars = 5 Mbps.

