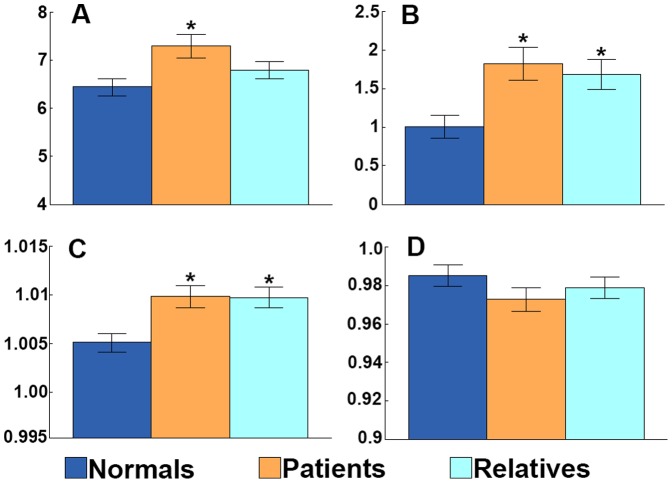
Figure 1. An abnormal EEG network topology is an endophenotype of IGE, present in patients and first-degree relatives.
Group means +/− standard error of the mean are shown for: (A) mean degree K, (B) mean degree variance D, (C) clustering coefficient  , and (D) normalised path length
  , in the 6–9 Hz band. Normal controls (dark blue), patients with IGE (orange), and first-degree relatives of patients with IGE (light blue). * = p<0.05 Bonferroni corrected compared with normal controls.

