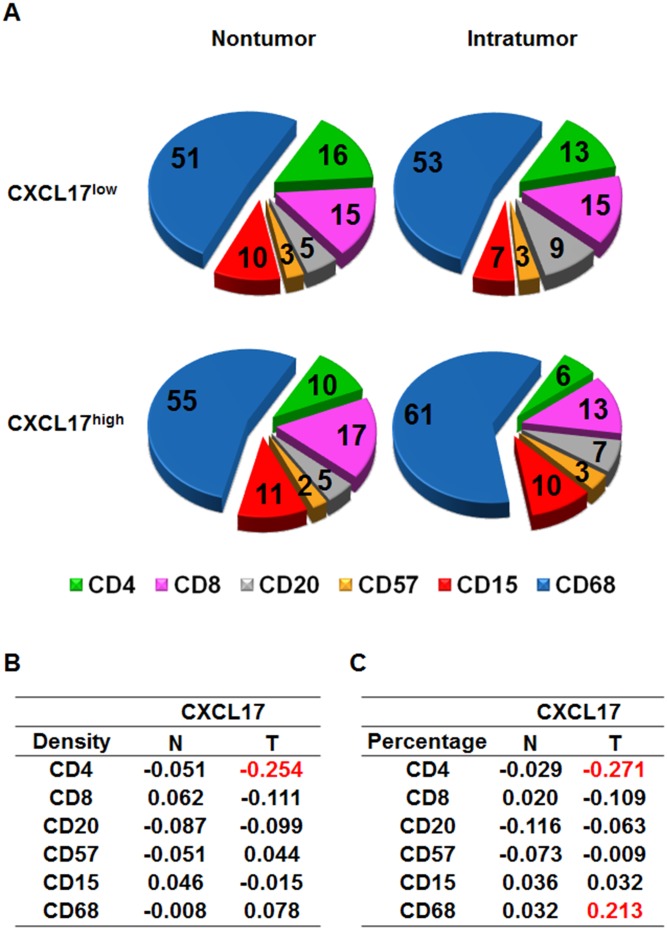
Figure 3. Composition of immune infiltrates according to CXCL17 expression.
(A) Pie charts summarized the percentages of nontumor-infiltrating (N, left) and tumor-infiltrating (T, right) CD4, CD8, CD20, CD57, CD15, and CD68 cells in CXCL17low and CXCL17high groups. (B, C) Correlation coefficients between the density or percentage of CXCL17 and the density of each immune cell subset were shown.

