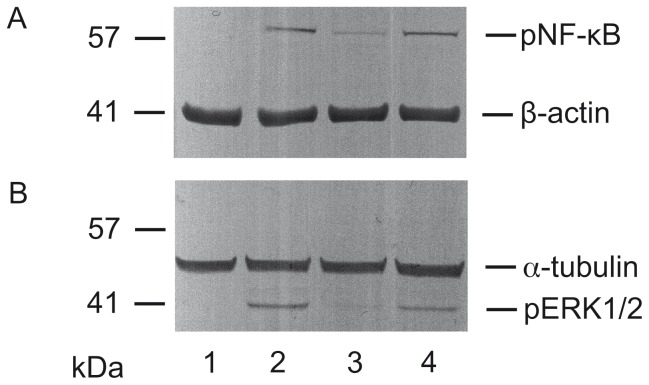
Figure 8. Influence of extract RA on TNF-α (A) and EGF (B) induced signal transduction in A549 cells.
Lanes 1 and 2 represent cells preincubated for 1 h with medium, lanes 3 and 4 with RA (100 µg/mL). (A) Stimulation of cells with TNF-α (20 ng/mL, 30 min.) (lane 2, 4), and detection of phosphorylated NF-κB; loading control β-actin; (B) stimulation of cells with EGF (30 ng/mL, 10 min.) (lane 2, 4), and detection of phosphorylated ERK1/2; loading control α-tubulin.

