
Figure 8. Effect of camelina oil-cakes on antioxidant enzymes expression.
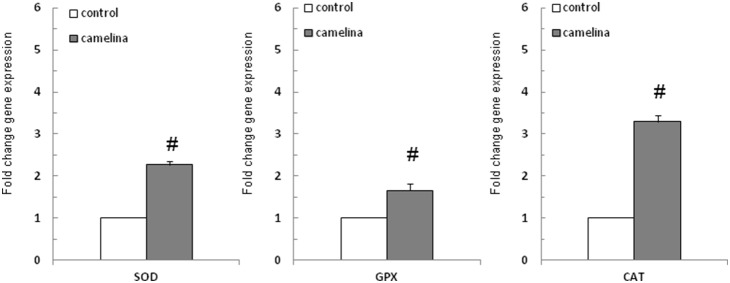
Spleen samples were taken at the end of the trial on day 33 and were analyzed for SOD, CAT and GPx mRNA expression by quantitative RT-PCR. Results are expressed as fold change after normalization of the expression of target gene to the mean of 2 internally reference genes expression. Values are the means ± SEM, from two replicates. Statistical analysis was performed using one-way ANOVA followed by Fisher test (*P<0.05, T1 diet-control group (white column) versus T2 diet -Camelina group (grey column).