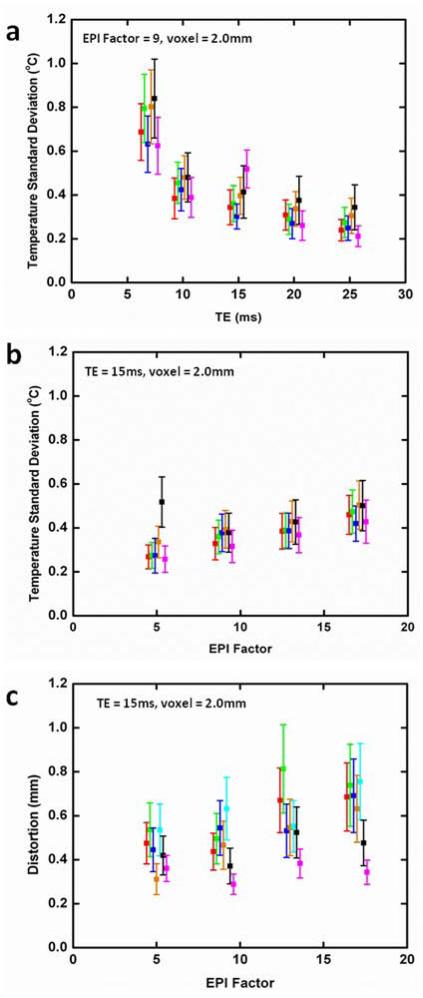
Figure 3.
Average temperature standard deviation as a function of (a) TE and (b) EPI factor. Distortion as a function of EPI factor is shown in (c). In these plots, each symbol color represents results for a different volunteer, averaged in each case over a prostate volume ROI. Values for constant parameters are indicated on each plot.

