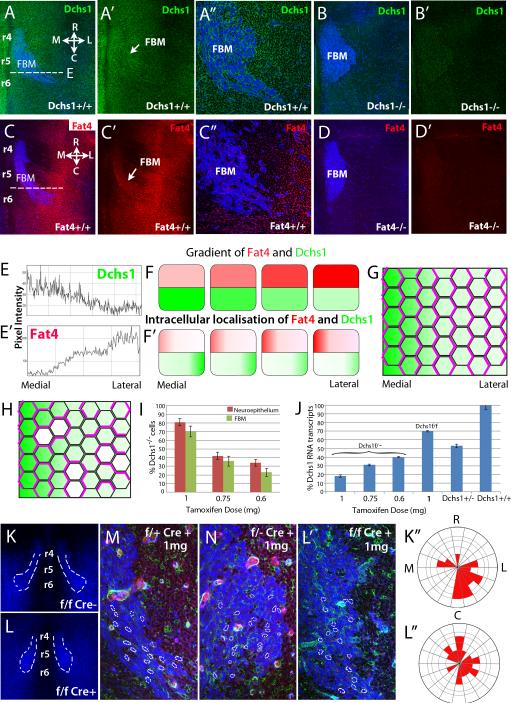
Figure 3. Gradients of Fat4 and Dchs1 expression may regulate FBM neuronal migration.
(A-D) E12.5 mouse hindbrains, stained for Islet1 to mark FBM neurons (blue) and (A,B) Dchs1 (green) or (C,D) Fat4 (red). (B,D) Antibody stains on mutant embryos, as a control for background staining. (E and E’) show intensity scan across the dashed line in (A, C) respectively to quantify expression gradients. (A” and C”), high power views of the FBM neurons. (F) Illustrates the Dchs1 and Fat4 expression gradients. (F’), the predicted intracellular localization of Dchs1 and Fat4 across the medio-lateral axis of cells. (G) Illustrates a field of cells polarised (indicated by polarised localization of pink lines) in response to a Dchs1 gradient (green). (H) Illustrates the expected consequences of small patches of Dchs1−/− cells (white). Cells locally repolarize around the mutant cells, and this repolarisation can propagate into neighbouring cells. Consequently, even though overall Dchs1 expression is only modestly affected, PCP is severely disturbed. (I-L) Cre-induced mosaic reduction in Dchs1 expression. (I) shows the percentage of GFP positive cells i.e. levels of mosaicism at different tamoxifen doses in the neuroepithelium and FBM neurons. (J) qPCR of Dchs1 expression in the hindbrain relative to heterozygous and wildtype mice in mosaics in Dchs1f/− and Dchs1f/f backgrounds. (K-L) Effect of Cre mosaicism on FBM neuronal migration visualised by Islet1 immunostaining (blue); the degree of mosaicism indicated by the GFP cells (green) in a tomato background (red in M,N), the nuclear shape and orientation of FBM neurons is outlined in (M,N,L’). (M-L), FBM neuronal migration in 1mg tamoxifen-induced heterozygous (Dchs1f/+Cre+ve (control,M), Dchs1f/−Cre+ve (N)) or wildtype (K,L; K is the control Cre-ve embryo and L is the Cre+ve embryo) backgrounds. For clarity, FBM neurons are outlined in (K,L). L’ is a high power view of the leading edge of the FBM neuronal stream shown in (L). (K”,L”) Golgi polarity in the FBM neurons in (K,L) is quantified in the Rose plots. R, rostral; C, Caudal; M, medial; L, Lateral. r, rhombomere

