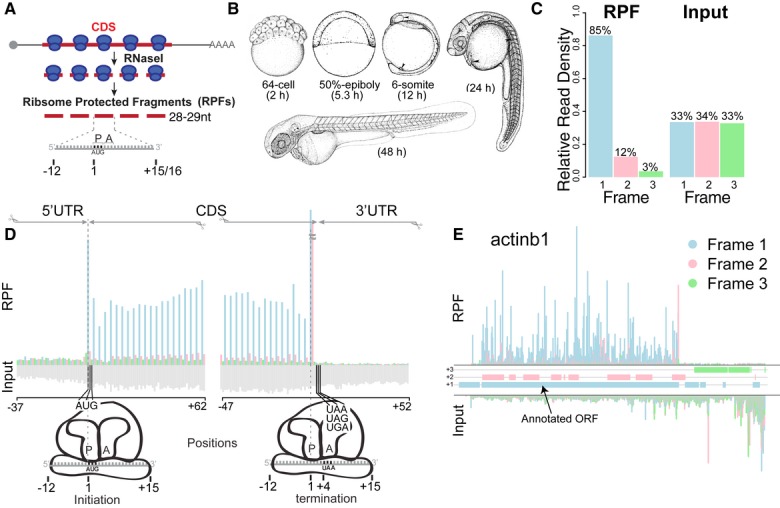
Figure 1. Ribosome profiling in zebrafish.

- Schematic representation of ribosome profiling: 28 to 29-nt-long ribosome-protected fragments (RPFs) are generated from nuclease digestion, where the P-site of the ribosome is in position 13.
- Developmental stages at which ribosome profiling was performed.
- Subcodon position of the ribosome footprints (position 13) for the RPF and input reads. Plot shows the proportion of RPFs or input reads aligned to the coding sequence of RefSeq genes at each position relative to the codon. Input reads were obtained after poly-(A) fractionation and random fragmentation of the naked RNA.
- RPFs and input reads mapped to a composite RefSeq transcript. RPFs mainly map to the CDS with a 3-nucleotide periodicity. RPF reads are colored as in (C) based on the position with respect to the frame of the CDS. Input reads map to both the UTRs and CDS (gray).
- Subcodon profile plot showing RPF and input reads aligned to actinb1. Reads are colored based on the frame (1, 2 or 3) position relative to the transcript (Michel et al, 2012). All putative ORFs (distal AUG-Stop) were also colored for each respective frame (blue, pink and green boxes). Note that most of the RPFs from the annotated ORF match the color of the box, consistent with a strong in-frame distribution of reads within individual transcripts.
