
Figure 2. Defining actively translated regions by ribosome profiling.
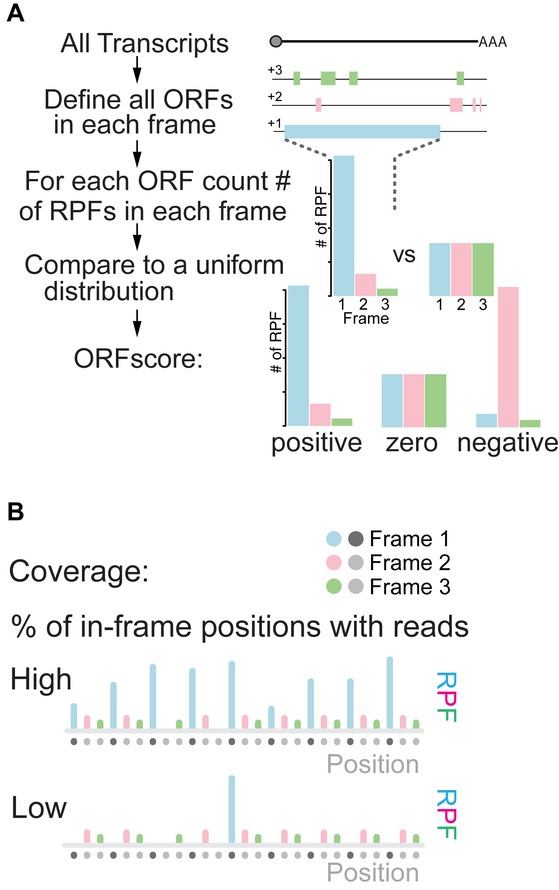
- Workflow to define the ORFscore: Top diagram represents a transcript, below solid bars represent all possible ORFs (Distal AUG-Stop) identified in each frame (+1, +2, +3). The RPF distribution in each frame is compared to an equally sized uniform distribution using a modified chi-squared statistic (see Materials and Methods). The resulting ORFscore is assigned a negative value when the distribution of RPFs is inconsistent with the frame of the CDS.
- Coverage is determined by measuring the proportion of in-frame CDS positions with ≥ 1 reads.