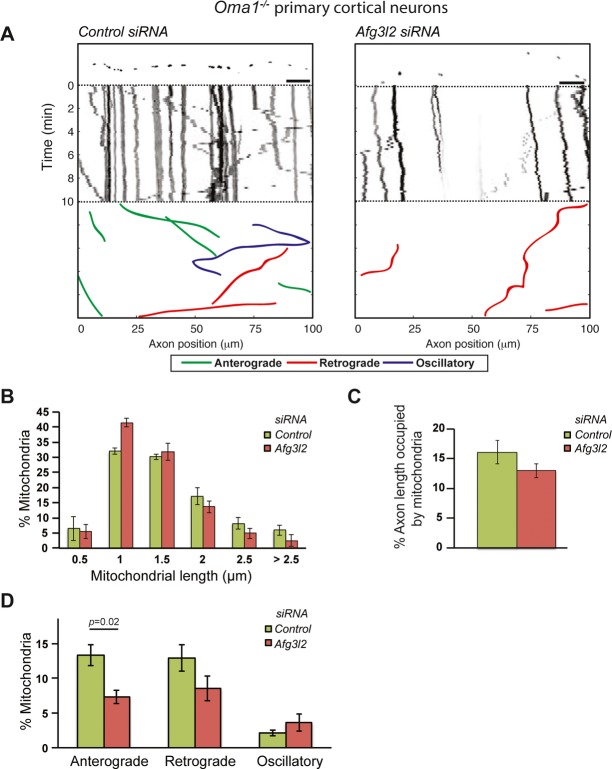
Figure 2. OMA1 ablation does not rescue mitochondrial transport defect of AFG3L2-depleted neurons.
- Representative kymographs of axons (shown above respective kymographs) from neurons isolated from Oma1 knockout mice co-transfected with mito-mCherry and control or Afg3l2 siRNAs. Schematic of different color-coded transport types is shown below. Scale bars, 10 μm.
- The percentage of mitochondria belonging to a given length bin was averaged from three independent experiments (105–200 mitochondria were measured in each experiment). Bars represent SEM.
- Quantification of mitochondrial occupancy per axon (n = 3 experiments; at least 8 axons per experiment).
- Quantification of mitochondrial transport types in the axon. Data represent mean ± SEM of three independent experiments. At least 8 axons from each experiment were analyzed. P-value was determined with Student's t-test.

