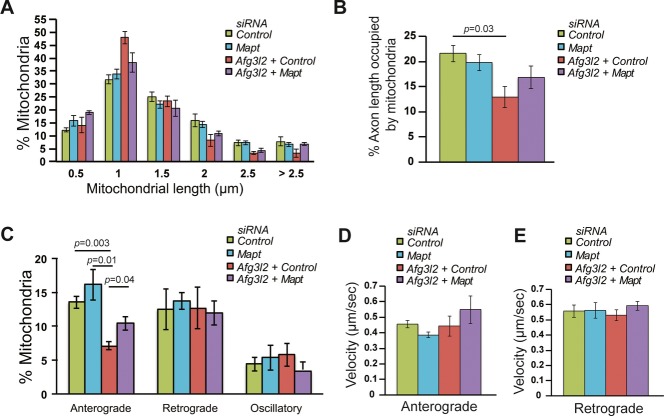
Figure 5. Tau levels affect mitochondrial transport in AFG3L2-depleted neurons.
A The percentage of mitochondria belonging to a given length bin was averaged from three independent experiments (120–210 mitochondria were measured in each experiment). Bars represent SEM. P-values were calculated with the chi-square test. Control vs. Afg3l2/control: P = 7 × 10⁻⁴, control vs. Afg3l2/Mapt: P = 9 × 10⁻³, Afg3l2/control vs. Afg3l2/Mapt: P = 5 × 10⁻⁵.
B Quantification of mitochondrial occupancy per axon (n = 3 experiments; 7–9 axons per experiment).
C Quantification of mitochondrial transport types in the axon. Data represent mean ± SEM of three independent experiments. 7–9 neurons from each experiment were analyzed.
D, E Average mitochondrial velocity in the anterograde (D) and retrograde (E) direction. Data represent mean ± SEM of three independent experiments. The velocity of mitochondria from 3 axons per experiment was analyzed.
Data information: P-values in (B) and (C) were determined with Student's t-test.

