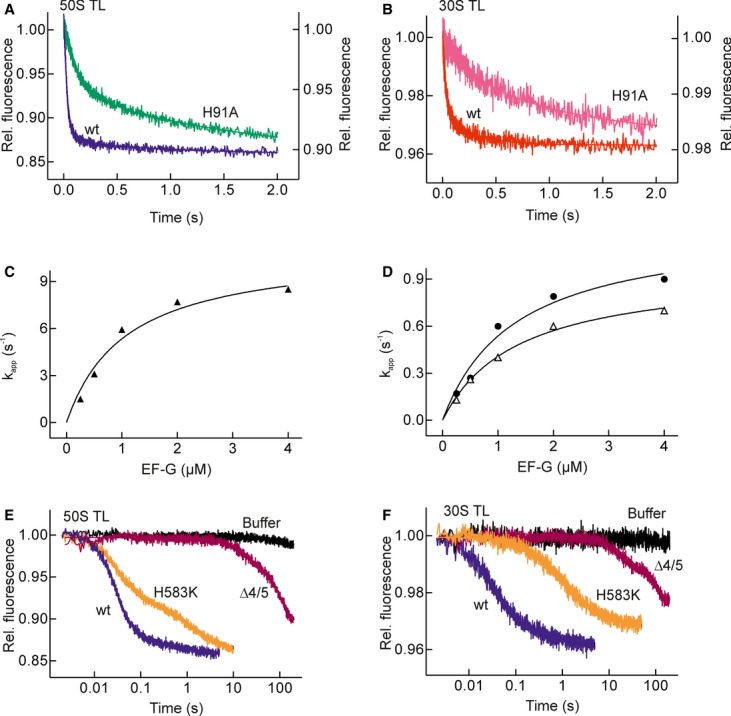
Time courses of 50S translocation in the presence of GTPase-deficient EF-G(H91A) (green, right Y-axis) compared with wt EF-G (blue, left Y-axis).
Time courses of 30S translocation in the presence of EF-G(H91A) (pink, right Y-axis) compared to wt EF-G (red, left Y-axis).
Concentration dependence of apparent rate constants of the fast step of 50S translocation as induced by EF-G(H91A) (▴).
Concentration dependence of apparent rate constants of the slow step of 50S translocation (△) and 30S translocation (•).
Time courses of 50S translocation with wt EF-G (blue), EF-G(H583K) (orange), EF-G(Δ4/5) (magenta) or without factor (Buffer, black).
Time courses of 30S translocation with wt EF-G and EF-G mutants (colors as in (E)).