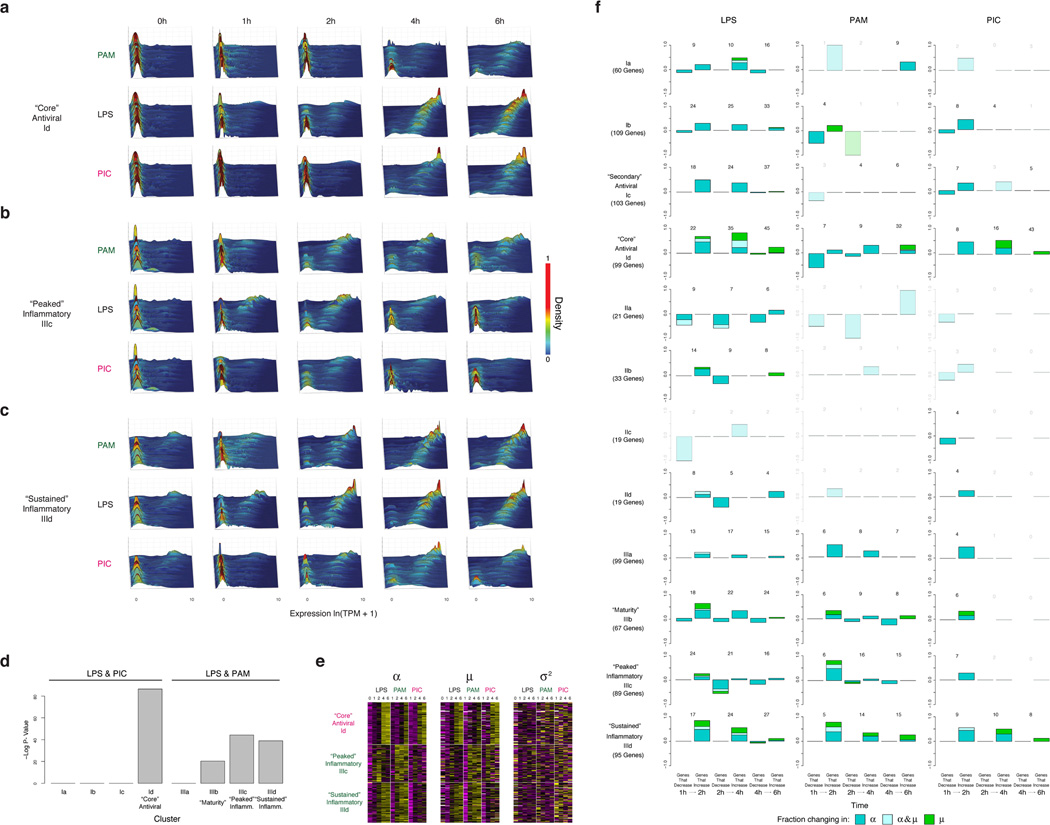
Extended Figure 5. Time-dependent behaviors of single cells from different modules and stimuli.
(a–c) For each of three key modules – “core” antiviral, Id (a), “peaked” inflammatory, IIIc (b), and “sustained” inflammatory, IIId (c) – shown are wave plots of all of its constituent genes in DCs stimulated with PAM (top), LPS (middle), or PIC (bottom) for 0,1,2,4 and 6h (left to right). X axis: expression level, ln(TPM+1); Y axis: genes; Z axis: single-cell expression density (proportion of cells expressing at that level). Genes are ordered from lowest to highest average expression value at the 4h LPS time point. (d) Contributions of each module to measured variation. Significance of the contribution of modules Ia-Id and IIIa-IIId from Fig. 1 to the variation measured throughout the stimulation time course. Shown is the p-value (Mann-Whitney test) of the tested association between each gene module and the first three PCs, calculated using a statistical resampling method (see SI). Only the “core” antiviral, maturity, and “peaked”/”sustained” inflammatory clusters show statistically significant enrichments with the three PCs. (e) Gene modules show coherent shifts in single-cell expression. Shown are heat maps of scaled α (left), µ (middle), and σ2 (right) values (color bar, bottom) in each time course (LPS, PAM, PIC) for the genes in each of the three key modules (rows, modules marked on left). Heat maps are row-normalized across all three stimuli, with separate scalings for each of the three parameters, to highlight temporal dynamics. Genes are clustered as in Fig. 1. (f) Dynamic changes in variation during stimulation in each module. For each module (rows) and stimulus (columns), shown are bar plots of the fraction of genes (Y axis) with a significant change only in α (by a likelihood ratio test, P<0.01, blue), only in µ (Wilcoxon test, P<0.01, green), or in both (each test independently, light blue), at each transition (X axis), in different conditions (marked on top) separated by whether they increase or decrease during that transition. In each module and condition, the proportion is calculated out of the genes in the module that are significantly bimodal (by a likelihood ratio test) in at least timepoint during the LPS response and are expressed in at least 10 cells in both conditions. Their number is marked on top of each bar; conditions with 3 or fewer genes changing are semi-transparent.

