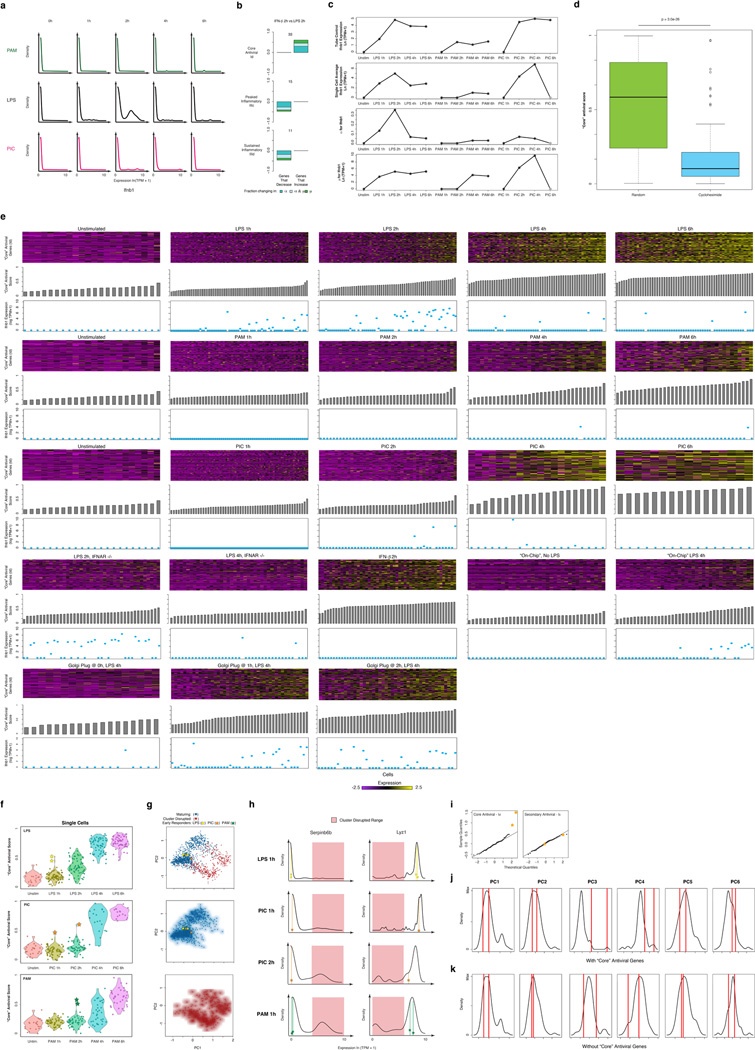
Extended Figure 9. Ifnb1 expression, production, and precocious cells.
(a–b) Ifnb1 mRNA expression and the effect of IFN-β on variation. (a) Single-cell expression distributions for the Ifnb1 transcript at each time point (top) after stimulation with PAM (top, green), LPS (middle, black), and PIC (bottom, magenta). Distributions are produced with the density function in R with default parameters, and scaled to have the same maximum density. (b) For each of three modules defined in Fig. 1 (core antiviral, top; peaked inflammatory, middle; sustained inflammatory, bottom), shown are bar plots of the fraction of genes (Y axis) with a significant change only in α (by a likelihood ratio test, P < 0.01, blue), only in µ (Wilcoxon test, P < 0.01, green), or in both (each test independently, light blue) between the 2h LPS stimulation and the 2h IFN-β stimulation separated by whether they increase or decrease during that transition. In each module and condition, the proportion is calculated out of the genes in the module that are significantly bimodal (by a likelihood ratio test) in at least time point during the LPS response and are expressed in at least 10 cells in both conditions. Their number is marked on top of each bar. (c–d) Ifnb1 mRNA expression patterns and effect of Cycloheximide. (c) From top to bottom, population average Ifnb1 mRNA expression (top), single-cell average Ifnb1 mRNA expression (second to top), α (second to bottom) and µ (bottom) estimates for Ifnb1 for each stimulation condition in Fig. 1. Grey star at 6h for PIC denotes uncertainty due to the small number of cells captured at that time point. (d) Shown are box plots of the “core” antiviral scores (population level, see SI) after a 4h LPS stimulation either where Cycloheximide was added at the time of stimulation (right, blue), or during a standard 4h LPS control (left, green). “Core” antiviral expression is dramatically decreased with addition of Cycloheximide, suggesting that newly produced protein is needed to initiate the antiviral response. (e) Relationship between “core” antiviral gene expression and Ifnb1 mRNA expression during the LPS, PAM, and PIC stimulation time courses and in follow-up experiments. Shown are the expression of “core” antiviral genes (heat maps: rows – gene; columns – cells) for cells stimulated for 0, 1, 2, 4, or 6 hours (left to right) with LPS (top), PAM (middle), or PIC (bottom). Beneath each heat map, grey bars depict the “core” antiviral score (middle panel, see SI) and blue dots show Ifnb1 mRNA expression for each cell in every heat map. (f–k) Identifying the “precocious” cells. (f) “Core” antiviral scores for cells stimulated with LPS, PIC, and PAM. Shown are violin plots of the core antiviral module scores (SI, Y axis) for each cell from time course experiments (from left: 0,1,2,4, and 6h) of DCs stimulated with LPS (top), PIC (middle) or PAM (bottom). Two “precocious” cells (yellow stars, top panel) have unusually high antiviral scores at 1h LPS (yellow stars, top); similarly “precocious” cells can be seen in PIC at 1 and 2h (orange stars, middle) or in PAM at 2h (turquoise stars, bottom). (g) “Precocious” cells in all three responses are typically maturing cells. PCA showing the separation between “maturing” (blue dots) and “cluster-disrupted” (red dots) cells (top), as well as only maturing (middle) or only cluster-disrupted (bottom) cells (all as also shown in Extended Fig. 4d). The “precocious” cells from each of the responses are marked as stars (colors as in (f)), and all fall well within the “maturing” cells. (h) “Precocious” cells in all three responses express Lyz1 and do not express Serpin6b. Shown are mRNA expression distributions for Serpin6b (cluster disruption cell marker, left) and Lyz1 (normal maturing cell marker, right) in LPS 1h, PIC 1 and 2h, and PAM 1h (top to bottom). The typical range for expression in cluster-disrupted cells is shaded in red. The “precocious” cells from each of the responses are marked as stars (colors as in (f)), and all fall well within the “maturing” cells. (i) Normal quantile plots of the expression of genes from the “core” (cluster Id, left) and secondary (cluster Ic, right) antiviral clusters at 1h LPS. The two “precocious” cells (yellow stars) express unusually high levels of “core” antiviral genes (left) but not of secondary genes (right). (j,k) The “precocious” cells are only distinguished by the expression of ~100 core antiviral genes. Shown are the distributions of scores for each of the first five PCs (right) for samples collected after stimulation with LPS for 1 hours with (j) or without (k) the inclusion of “core” antiviral genes. “Precocious” cells (vertical red bars), normally distinguished by the 3rd and 4th principle components (j), become indistinguishable from all other cells if the ~ 100 “core” antiviral genes are excluded (k) prior to performing the PCA.

