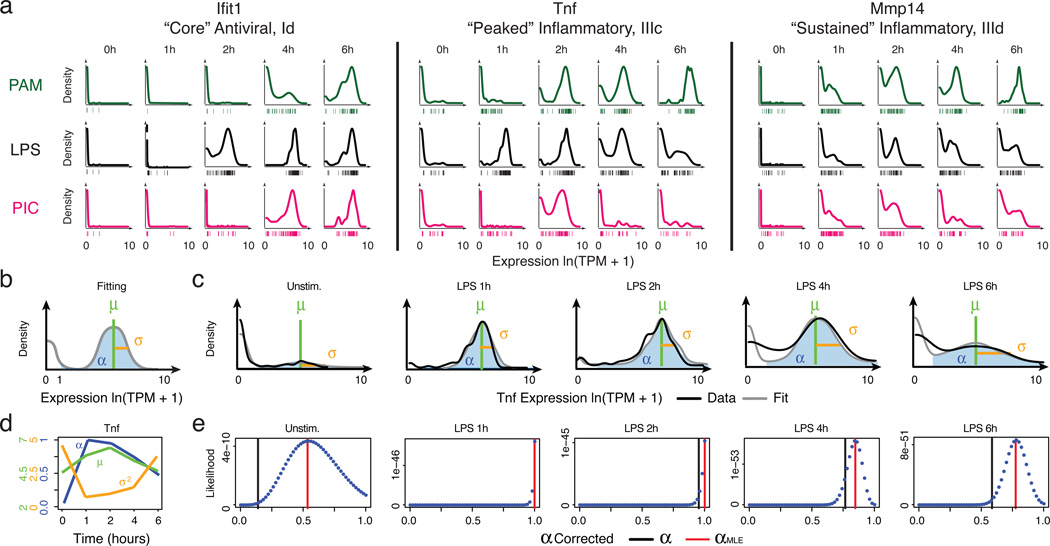
Figure 2. Time-dependent behaviours of single cells.
(a) Single-cell expression distributions for three genes at each time point after stimulation with PAM (top, green), LPS (middle, black), or PIC (bottom, magenta). Distributions are scaled to have the same maximum height. Individual cells are plotted as bars underneath each distribution. (b) Three parameters describing single-cell expression distributions: µ (green) and σ2 (gold), the mean and variance of RNA abundance in detectably expressing cells, respectively, and α (blue), the fraction cells with detectable expression (at ln(TPM+1)>1). (c) Examples of fit (grey) and measured Tnf expression distributions (black). (d) The values of µ, σ2, and α (Y axes, left to right) computed for Tnf at each time point (X axis). Units for µ and σ2 are ln(TPM+1). (e) Maximum likelihood estimate α(αMLE). Shown are the likelihood functions (dotted blue line) for Tnf (matching c) used to determine αMLE (red line; black bar: nominal α; SI).

