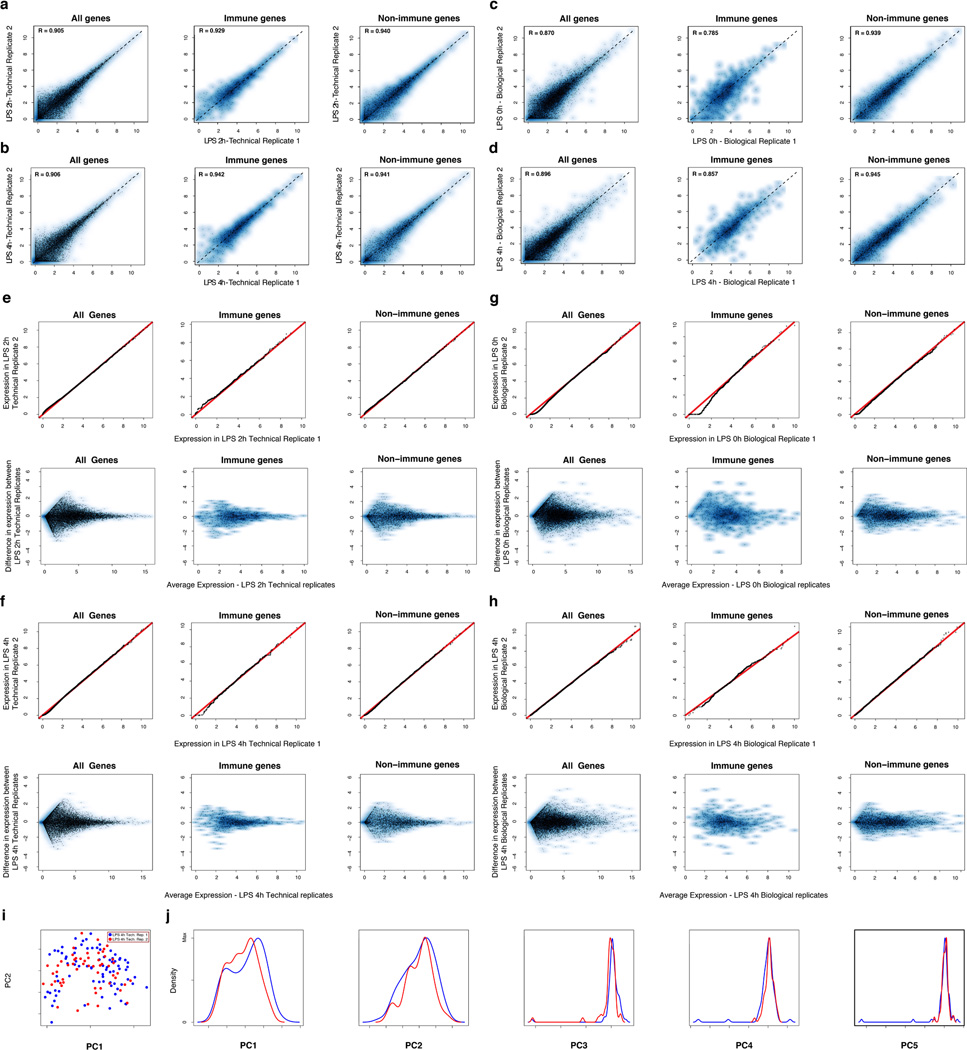
Extended Figure 3. Technical and biological reproducibility.
(a–d) Scatter plots showing the relation between the average single-cell expression estimates in either two technical replicates (LPS 2h (a), LPS 4h (b)) or two biological replicates (Unstimulated/LPS 0h (c), LPS 4h (d)) for all genes (top), immune response genes (middle), or non-immune response genes (bottom). (e–f) QQ plots (top) and MA plots (bottom) showing the similarity in expression estimates for the two LPS 2h technical replicates (e) or the two LPS 4h technical replicates (f). Plots are provided across all genes (left), non-immune response genes (middle), or immune response genes (right). (g–h) QQ plots (top) and MA plots (bottom) showing the similarity in expression estimates for all cells (including cluster-disrupted cells) in the two LPS 0h/unstimulated biological replicates (g) or the two LPS 4h biological replicates (h) across either all genes (left), non-immune response genes (middle), or immune response genes (right). Note, that slight variations in the fraction of cluster-disrupted cells and activation state of one of the two 0h samples results in mild deviations between immune response gene estimates in those biological replicates. (i–j) PCA for the two LPS 4h technical replicates. (i) The first two principal components (PC1 and PC2, X and Y axis, respectively) from a PCA from the two LPS 4h stimulation technical replicates (blue: replicate 1; red: replicate 2). (j) The distributions of scores for cells from each of the two technical replicates on each of the first five PCs (left to right: PC1 to PC5).

