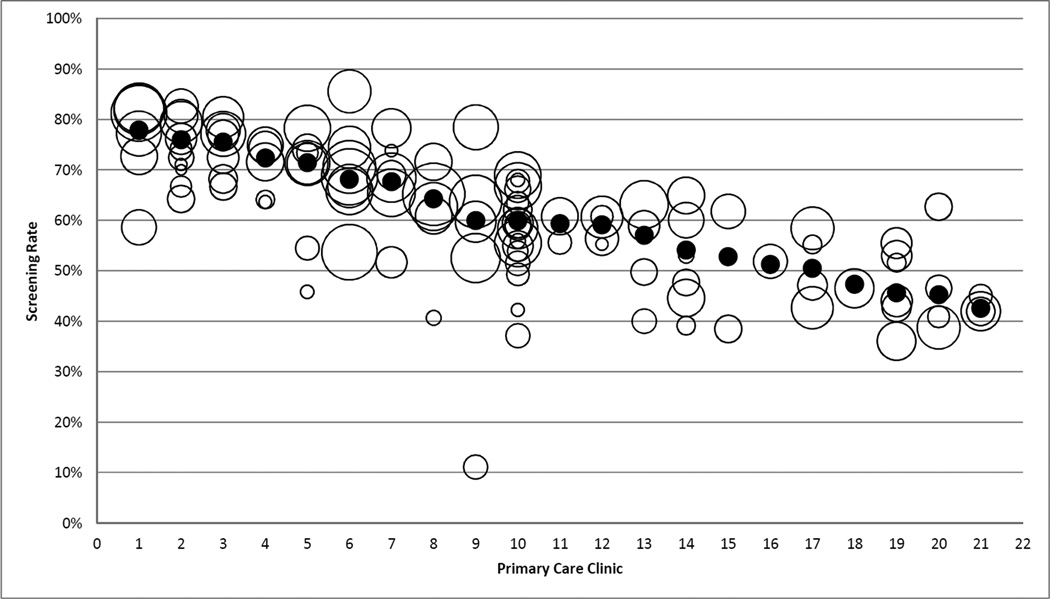
Figure 2. 2007 colorectal cancer screening rates among WCHQ provider groups: Black bubble indicates UW Health performance.
White bubbles are the other provider groups reporting to WCHQ. Size of the bubbles corresponds to the size of the denominator (number of patients eligible for screening at each organization). These data were measured from January 1, 2007 to December 31, 2007.
Abbreviations: WCHQ, Wisconsin Collaborative for Healthcare Quality.

