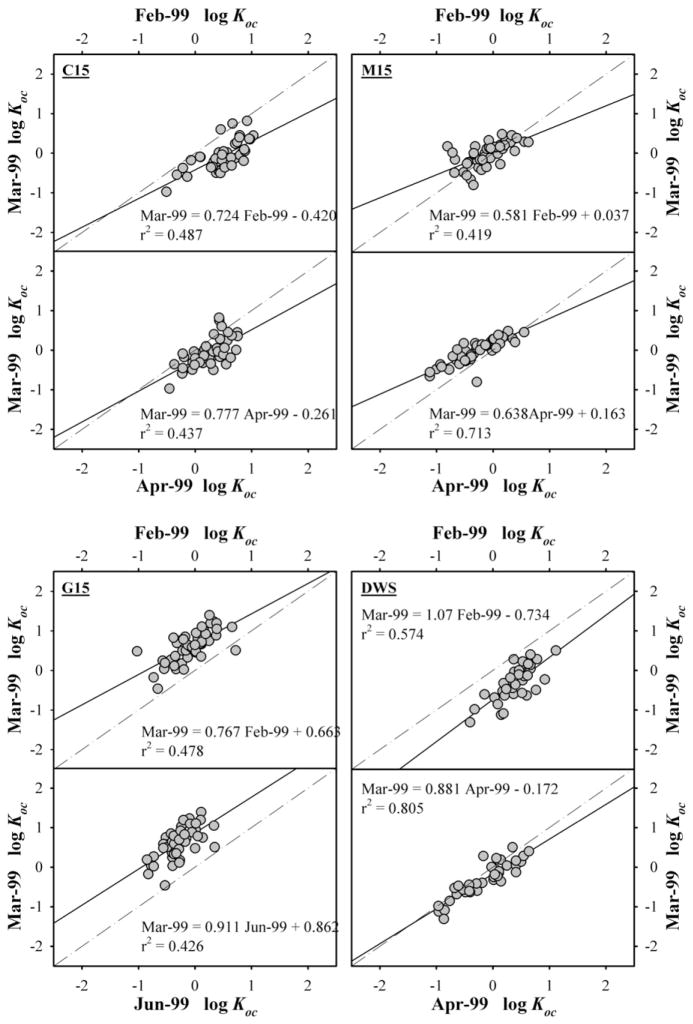
Fig. 6.
Comparison of log Koc for PCB congeners measured at stations where samples were collected prior to, during, and after sediment resuspension in 1999. Each point represents congener for which the concentration was greater than zero in both the dissolved phase and suspended sediment. The solid line represents the linear fit through the data. The dashed line represents a line of unity for comparison only.

