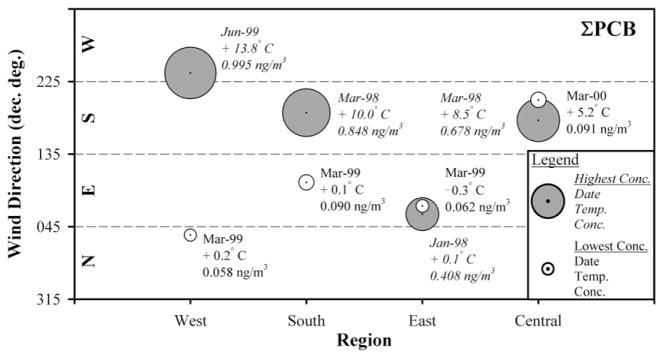
Fig. 8.

Highest and lowest ΣPCB gas phase concentrations (ΣPCBg) measured in each of the four regions of southern Lake Michigan. Bubble size indicates the relative concentration magnitude. Each bubble is centered within the range of prevailing cardinal wind direction (decimal degrees) measured during sampling. Corresponding air sample averaged air temperature (°C) and concentration (ng/m3) are indicated next to each bubble.
