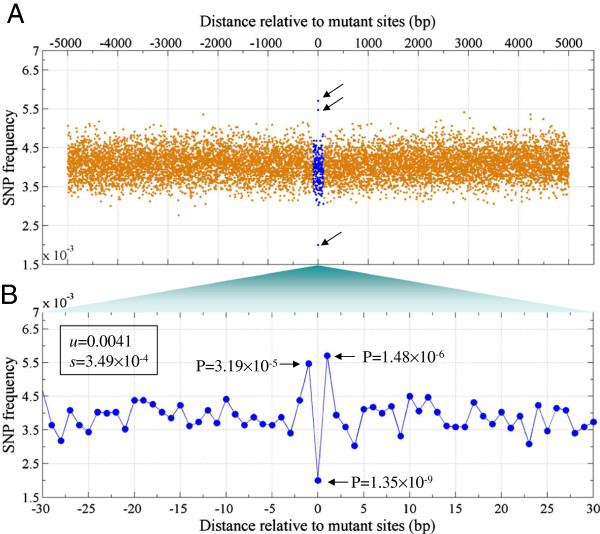
Figure 5.
New mutations occur at SNP sites with a lower probability and frequently occur at the -1 and +1 position relative to the mutation sites. A: SNP frequency around the somatic mutation sites of malignant melanoma; B: A zoom-in plot of Figure 4A. P-values are calculated from normalization distribution of SNP frequencies.

