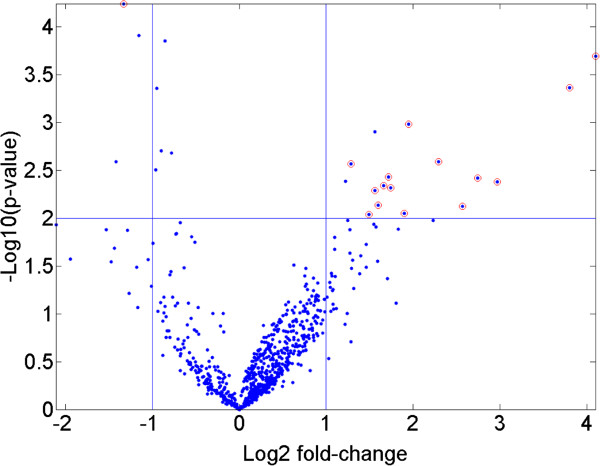
Figure 3.
Criteria for differentially expressed miRNAs. The scatter plot illustrates the p-values as a function of fold-change that defined significantly differentially expressed miRNAs. Sixteen DEmiRs that met the criteria of more or less than 2-fold over- or under expressed relative to controls (log2 expression less than −1 or greater than +1) with p-values lower than 0.01 (−log102) are shown. Similar criteria were applied for the selection of DEmiRNA from urine or serum.

