
Figure 1.
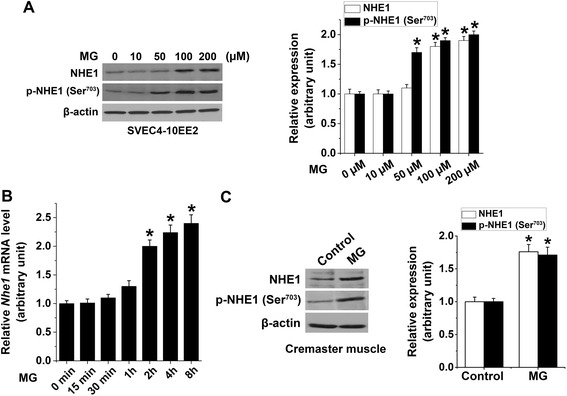
Methylglyoxal-induced upregulation of NHE1 expression. (A) Representative original Western blot and means ± SEM (n = 4) showing total NHE1 and phospho-NHE1 (14-3-3 binding motif at p-Ser703) determined in MG-treated (0–200 μM for 4 h) EE2 ECs (relative to β-actin). * indicates significant difference (p < 0.05) from 0 μM MG. (B) Mean ± SEM of NHE1 mRNA levels (n = 4) determined in MG-treated (100 μM for 0–8 h) EE2 ECs (relative to β-actin). * indicates significant difference (p < 0.05) from 0 h. (C) Representative original Western blot and means ± SEM (n = 4) showing total NHE1 and phospho-NHE1 (14-3-3 binding motif at p-Ser703; relative to β-actin) determined in excised cremaster muscle 4 h after an intrascrotal injection with saline (Control) or MG (50 mg/kg). * indicates significant difference (p < 0.05) from the absence of MG (Control).