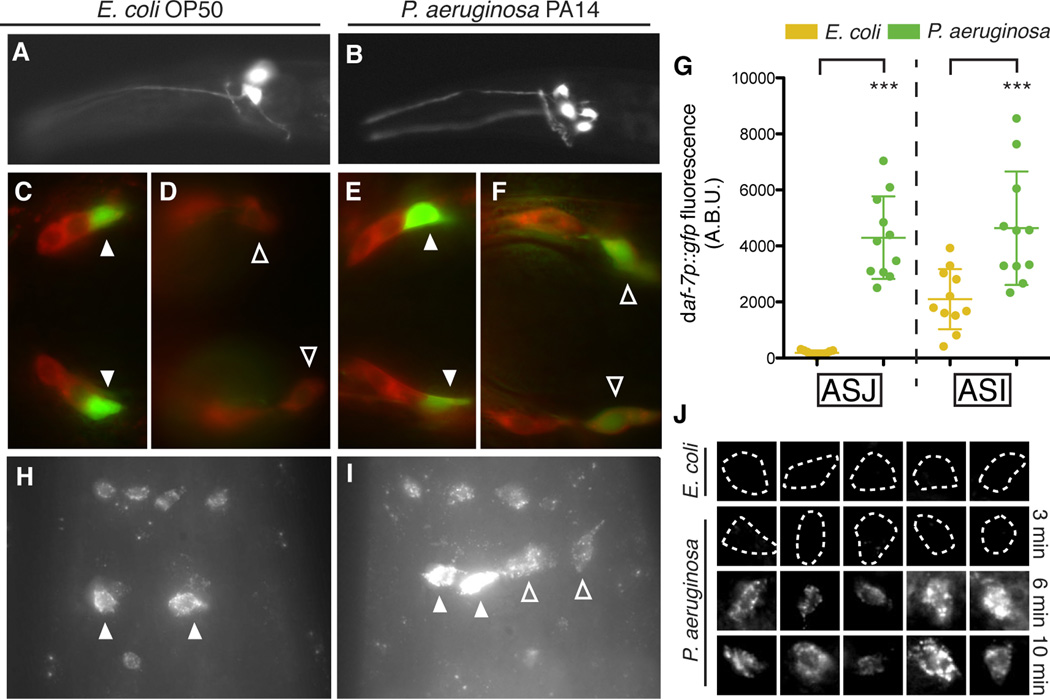
Figure 2. daf-7 expression is induced in the ASJ neurons upon exposure to P. aeruginosa.
(A–B) daf-7p∷gfp expression pattern in C. elegans on E. coli (A) and P. aeruginosa (B). (C–F) Co-localization of daf-7p∷gfp expression and DiI staining (red) in animals on E. coli, dorsal view (C) and ventral view (D), and in animals on P. aeruginosa, dorsal view (E) and ventral view (F). Filled triangles indicate ASI neurons; empty triangles indicate ASJ neurons. (G) Maximum fluorescence values of daf-7p∷gfp in the ASJ or ASI neurons after 16 h exposure to indicated bacteria. *** P < 0.001 as determined by one-way ANOVA followed by Tukey’s Multiple Comparison Test. Error bars indicate standard deviation. (H–I) daf-7 FISH in wild-type N2 animals on E. coli (H) and P. aeruginosa (I). Filled triangles indicate ASI neurons; empty triangles indicate ASJ neurons. Additional cells expressing daf-7 mRNA are the OLQ neurons (top) and the ADE neurons (bottom). (J) daf-7 FISH in the ASJ neurons (co-localized with trx-1p∷gfp) on E. coli and P. aeruginosa after various exposure times. Dashed lines indicate cell boundaries. Each image represents an individual animal. See also Figure S2.

