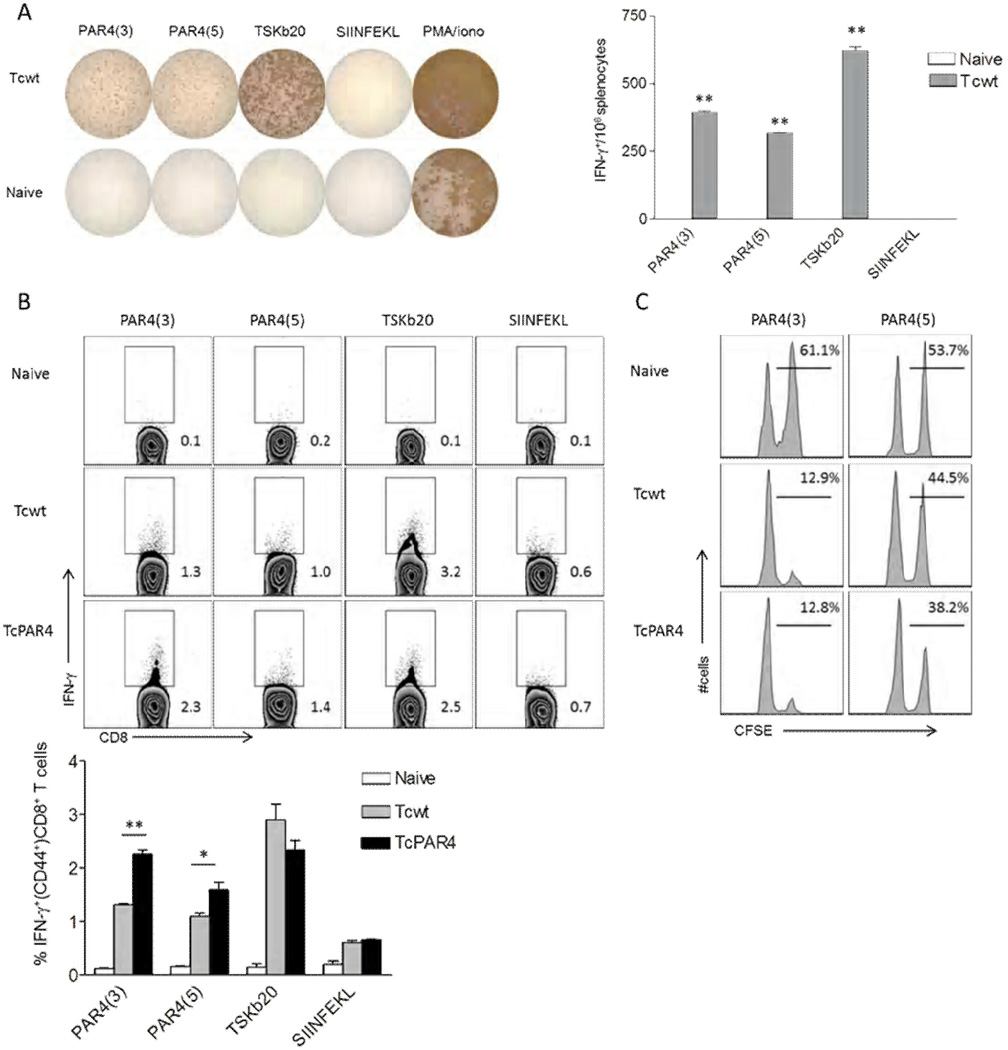
Figure 5. Target epitope identification in PAR4-specific CD8+ T cells.
(A) Representative wells of IFN-γ ELISPOT assay, where splenocytes from naïve or Tcwt infected (30 dpi) mice were restimulated for 18 hrs with the PAR4 peptides PAR4(3) or PAR4(5). T. cruzi trans-sialidase derived TSKb20, chicken ovalbumin derived SIINFEKL peptides or PMA/ionomycin served as controls. Bar graph indicates the average spots per well (±SEM) for each group from a representative of 3 trials with 3 mice/ group. ** indicates p≤0.01 comparing the indicated groups to SIINFEKL control by student t-test. (B) Representative intracellular IFN-γ staining of splenocytes derived from naïve, Tcwt or TcPAR4 infected (30 dpi) mice restimulated with PAR4(3), PAR4(5), TSKb20 or SIINFEKL for 5 hrs. Histograms are gated on CD8+ CD44+ lymphocytes, with the inset numbers indicating the percentage of IFN-γproducing CD8+ T cells. The bar graph summarizes data from an experiment with 3 mice/ group. (C) Representative histograms comparing specific killing of PAR4(3) or PAR4(5) (CFSEhi)/ SIINFEKL (CFSElo) peptide pulsed target splenocytes inoculated into and recovered 18h later from- naïve, Tcwt or TcPAR4 infected (300 dpi) mice. The inset numbers represent the percentage of PAR4(3) or PAR4(5) pulsed over total donor splenocytes recovered. Data represent an experiment with 3 mice/group. ** or * indicates p≤0.01 or ≤0.05 respectively by student t-test. All data are representative of at least 3 separate trials.

