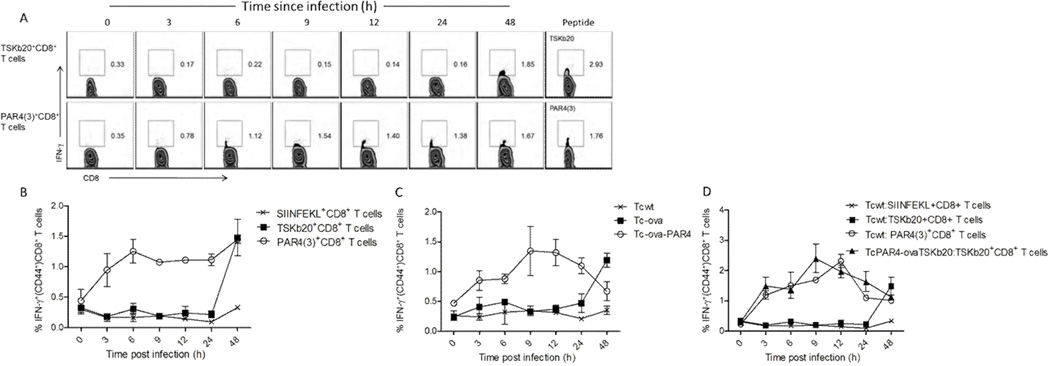
Figure 7. Rapid detection of T. cruzi infected cells by PAR4-specific CD8+ T cells.

Representative flow plots (A) and line graph (B) showing the timing of IFN-γ response of TSKb20- or PAR4-specific splenic CD8+ T cells restimulated with murine fibroblasts infected with T. cruzi for the indicated lengths of time. Restimulation with the corresponding peptide epitopes served as controls. All histograms are gated on CD8+ CD44+ lymphocytes, with the inset numbers indicating the percentage of IFN-γ producing cells. SIINFEKL specific CD8+ T cells served as controls. (C)Timing of IFN-γ response in OVA specific CD8+ lymphocytes derived from Lm-ova infected mice co-incubated with murine fibroblasts infected with Tcwt, Tc-ova or Tc-ova-PAR4 for the indicated lengths of time. (D) Timing of IFN-γ response in OVA/TSKb20/PAR4(3) specific CD8+ splenic lymphocytes co-incubated with murine fibroblasts infected with Tcwt or TcPAR4-ovaTSKb20 for the indicated lengths of time. The line graphs present data as mean ± SEM from one of three separate experiments. See also figure S7.
