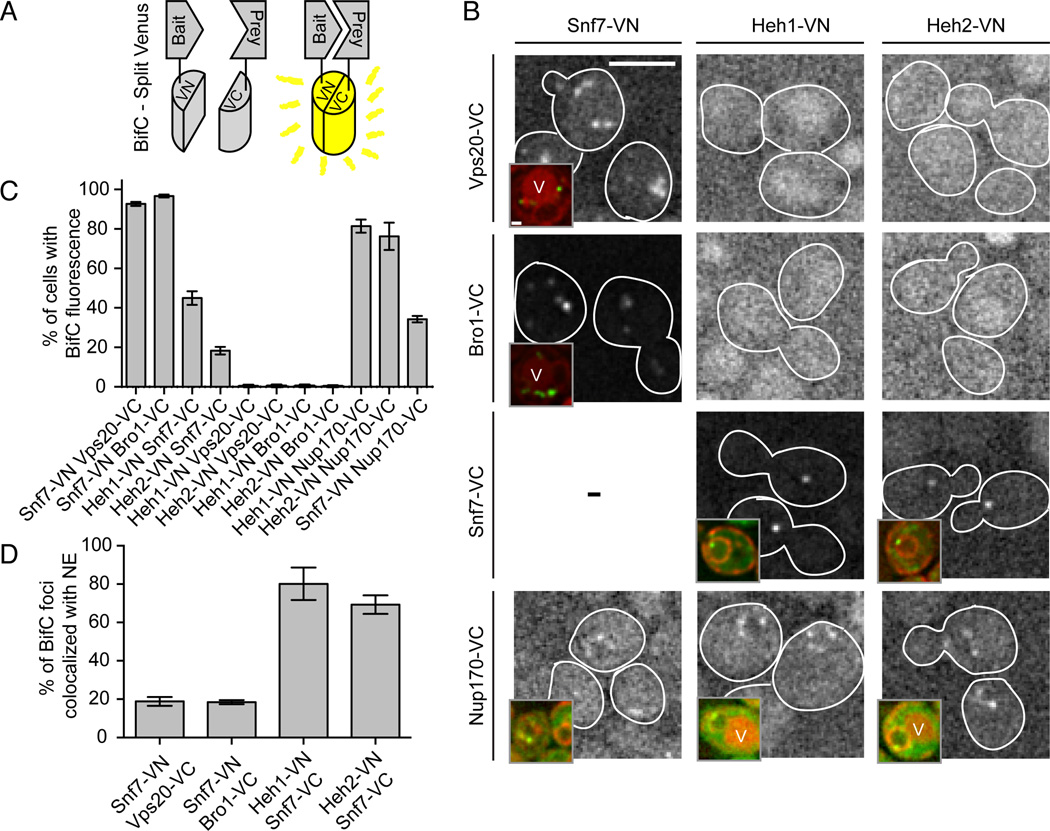
Figure 2. Snf7 physically interacts with Heh1 and Heh2 at the NE.
(A) Diagram of BifC where bait and prey are co-expressed as VN and VC fragments of Venus. Interactions of bait and prey result in Venus fluorescence.
(B) Snf7 interacts with Heh1, Heh2 and Nup170 at the NE. Fluorescent micrographs of cells expressing VC and VN fusions. Background fluorescence has been enhanced to facilitate interpretation of the low signal to noise in some cells. Cell boundaries traced from transmitted light images (not shown). Bar is 5µm. Insets are a merge of fluorescent micrographs of Venus and the NE/ER marker HDEL-dsRed. In some cells vacuoles (V) are visible due to autofluorescence. Bar in inset is 1 µm.
(C) Plot of the percentage of cells expressing VN and VC fusions where Venus was observed. Plots are mean +/− s.d. from 3 experiments (n>200).
(D) Plot of the percentage of fluorescent spots seen colocalized with HDEL-dsRED at the NE. Mean +/− s.d. from 3 experiments (n>40).
See Figure S2.

