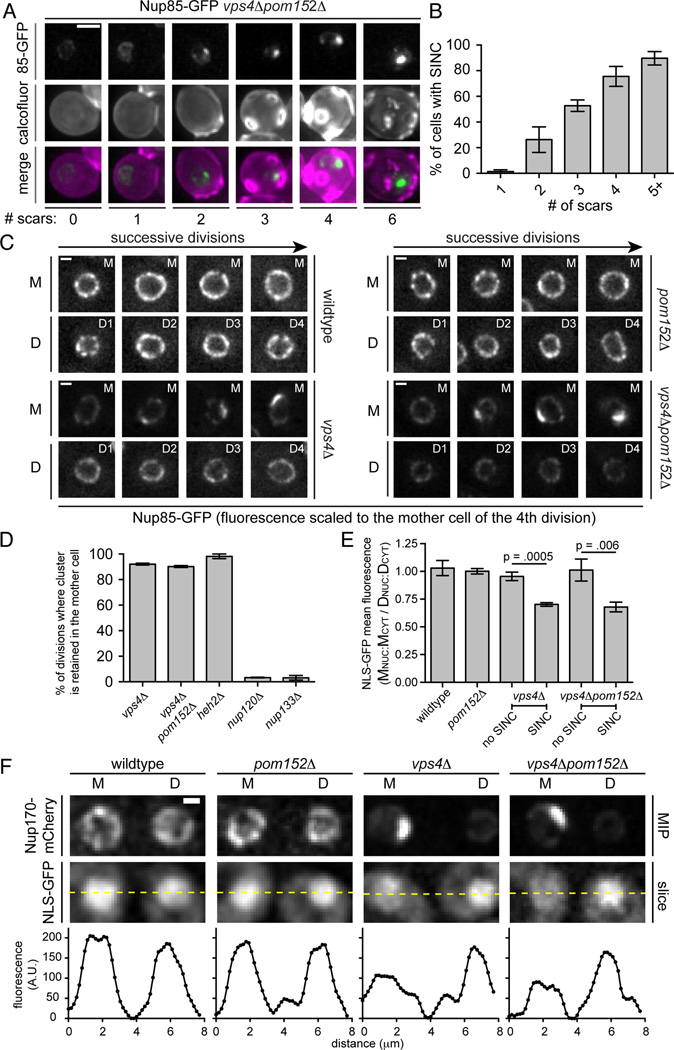
Figure 6. The SINC is not transmitted to daughter cells.
(A) The SINC accumulates in old mothers. Fluorescence micrographs of Nup85-GFP in vps4Δpom152Δ cells with the indicated number of bud scars stained with calcofluor. Bar is 1 µm.
(B) Plot of percentage of cells with Nup85-GFP in SINC in reference to bud scar number. Mean +/− s.d. from 3 experiments, n>60.
(C) The SINC is retained in mother cells. Images of Nup85-GFP at a mother (M) nucleus and of its four daughter nuclei (D1-D4) in the indicated strains. Fluorescence in each image series is normalized to the fluorescence of the mother cells after the final division to avoid saturating the SINC signal. Bar is 1µm.
See Movie S1.
(D) NPC clusters of nup120A and nup133A strains are not retained in mothers. Plot of the percentage of divisions that result in the retention of nup clusters in mother. Mean +/− s.d. from 3 experiments.
(E) Nuclear compartmentalization is lost in vps4A mother cells. Plot of the quantification of the relative nuclear accumulation of NLS-GFP between individual mother (M) and daughter (D) cells expressed as a ratio of MNUC:MCYT to DNUC:DCYT. Eleven divisions (mother and daughter) analyzed from 3 experiments. Mean +/− s.d. P values from an unpaired, two-tailed t-test.
(F) Daughter cells retain nuclear transport. Fluorescence micrographs of NLS-GFP of a mother (M) and its daughter (D) after division. Fluorescence intensities along indicated lines are plotted. MIP is maximum intensity projection. Bar is 1µm.

